Deskripsi
⭐ MULTI‑TIMEFRAME SMC ZONE™ 🇫🇮
Pemetaan Pasokan & Permintaan Institusional di Lima Kerangka Waktu — Secara Otomatis.
Produk Profesional
Multi‑Timeframe SMC Zone Engine™ adalah indikator Smart Money Concepts yang dibangun dengan presisi yang secara otomatis mendeteksi, menggambar, dan menyinkronkan zona pasokan dan permintaan institusional di lima kerangka waktu utama — semuanya secara real time, langsung di grafik Anda.
Dirancang untuk trader yang mengandalkan struktur pasar, perilaku likuiditas, dan jejak institusional, alat ini menghilangkan tebakan dan ketidakkonsistenan dalam penandaan zona manual. Baik Anda trading intraday atau swing, Multi‑Timeframe SMC Zone Engine™ memberi Anda peta lengkap berlapis-lapis tentang di mana pasar kemungkinan besar akan bereaksi.
Ini bukan sekadar indikator.
Ini adalah sistem intelijen SMC multi-kerangka waktu.
Kemampuan Inti
Deteksi Zona Pasokan & Permintaan Otomatis
Mesin memindai X bar terakhir (ditentukan pengguna) pada setiap kerangka waktu dan mengidentifikasi:
Zona Permintaan (ketidakseimbangan bullish)
Zona Pasokan (ketidakseimbangan bearish)
Zona divalidasi menggunakan struktur candle — memastikan hanya jejak institusional yang bermakna yang ditampilkan.
Lima Kerangka Waktu, Satu Grafik
Indikator menganalisis secara bersamaan
Harian
4H
1H
30M
15M
Setiap kerangka waktu diberi warna unik, memberi Anda tampilan berlapis yang bersih tentang kekuatan kerangka waktu lebih tinggi dan presisi kerangka waktu lebih rendah.
Fusi multi-kerangka waktu ini adalah apa yang diandalkan trader SMC untuk mengantisipasi sapuan likuiditas, blok mitigasi, dan zona premium/diskon.
Proyeksi Zona Dinamis
Setiap zona secara otomatis diperpanjang ke candle terbaru, memungkinkan Anda melihat:
Di mana harga kemungkinan akan bereaksi
Zona mana yang masih aktif
Bagaimana harga saat ini berinteraksi dengan jejak institusional
Tidak ada penggambaran ulang manual. Tidak berantakan. Tidak ada zona usang.
Visual Profesional
Setiap zona mencakup:
Persegi panjang berwarna dengan lebar border yang dapat disesuaikan
Label teks yang jelas (“Demand: H1”, “Supply: M15”, dll.)
Penempatan geser kiri cerdas untuk menghindari tumpang tindih candle
Hasilnya adalah peta SMC yang bersih, dapat dibaca, dan berkelas profesional.
Mengapa Trader Menyukainya
Menghilangkan penandaan zona manual
Menyediakan konteks multi-kerangka waktu secara instan
Membantu mengidentifikasi titik reaksi dengan probabilitas tinggi
Bekerja dengan strategi apa pun yang berbasis SMC, ICT, Wyckoff, atau konsep likuiditas
Visual yang bersih yang tidak membebani grafik Anda
Sempurna untuk scalper intraday maupun trader swing
Alat ini memberi Anda perspektif institusional — tanpa kerumitan.
Untuk Siapa Indikator Ini
Trader Smart Money Concepts
Trader likuiditas gaya ICT
Trader struktur pasar dan aliran order
Scalper yang membutuhkan presisi
Trader swing yang membutuhkan konteks kerangka waktu lebih tinggi
Siapa pun yang menginginkan peta pasokan/permintaan yang bersih dan otomatis
⭐ MULTI‑TIMEFRAME SMC ZONE™
Trading dengan kejelasan jejak institusional — di setiap kerangka waktu yang penting
Catatan
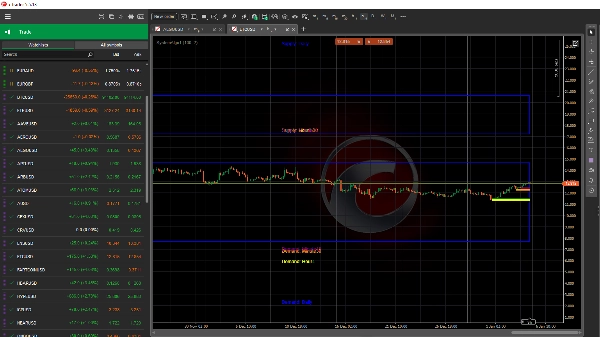
Biru = permintaan/pasokan harian
Hijau = permintaan/pasokan 4H
Kuning = permintaan/pasokan 1H
Ungu gelap = permintaan/pasokan 15 menit
merah muda = permintaan/pasokan 5 menit
ketika tumpang tindih > peluang lebih besar untuk perdagangan yang sukses
Ringkasan
The indicator assigns unique colors to each timeframe’s zones for clear, layered visualization, enabling traders to assess higher-timeframe strength alongside lower-timeframe precision. Zones are dynamically extended to the latest candle, showing active areas where price is likely to react without manual redrawing or clutter.
Each zone is visually marked with a colored rectangle, adjustable border width, and clear text labels indicating timeframe and zone type, placed to avoid overlap with price candles. This tool supports trading strategies based on market structure, liquidity, and institutional footprints, including SMC, ICT, Wyckoff, and liquidity concepts.
SystemAlgo1 is suitable for intraday scalpers and swing traders seeking automated, multi-timeframe supply and demand mapping to identify high-probability reaction points across markets such as Forex, cryptocurrencies, indices, commodities, and stocks.