
CO ROBI
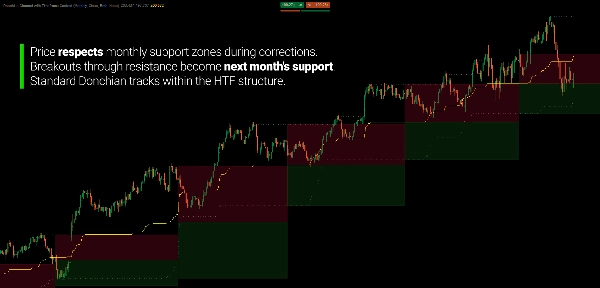
Kanał Donchiana z kontekstem ram czasowych nakłada granice strukturalne wyższych ram czasowych na Twój aktualny wykres — dając każdemu wybiciu i cofnięciu ramę odniesienia, której standardowe kanały Donchiana nie zapewniają.
Standardowy kanał Donchiana rysuje najwyższy szczyt i najniższy dołek w ustalonym okresie patrzenia wstecz na Twojej bieżącej ramie czasowej. Jest skuteczny w identyfikacji wybicia — ale działa w izolacji. Wybicie na wykresie 15-minutowym może być niczym więcej niż szumem w ramach tygodniowego zakresu.
Ten wskaźnik dodaje ten brakujący kontekst.
Oblicza zakres poprzedniego okresu wyższej ramy czasowej i projektuje go jako strefy wsparcia/oporu na Twoim wykresie wykonawczym. Widzisz oba: standardowy kanał Donchiana śledzący ekstremalne ceny bieżącej ramy czasowej oraz kontekst wyższej ramy czasowej pokazujący, gdzie cena znajduje się względem większych granic strukturalnych.
Efektem jest kanał Donchiana, który wie, gdzie się znajduje w szerszym obrazie.
DLACZEGO KONTEKST RAM CZASOWYCH MA ZNACZENIE
Kanał Donchiana jest jednym z najbardziej szanowanych systemów wybicia w handlu. Oryginalna koncepcja Richarda Donchiana — kupuj najwyższy szczyt, sprzedawaj najniższy dołek — pozostaje fundamentem strategii podążania za trendem. Jednak sam kanał nie mówi, czy widziane wybicie jest strukturalnie istotne.
Problem
Standardowe wybicie Donchiana na ramie czasowej Twojego wykresu powoduje typowe frustracje:
- Cena przebija górną granicę kanału na H1 — ale tygodniowy zakres mówi, że trafia na opór, a nie zaczyna trendu
- Cena testuje dolną granicę kanału na M15 — ale dzienny kontekst pokazuje silny popyt poniżej, który nie był testowany
- Wchodzisz w handel wybiciowy z pewnością — tylko po to, by obserwować odwrócenie ceny, ponieważ ruch był korekcyjny w ramach większej struktury czasowej
To nie są błędy wskaźnika. To błędy kontekstu. Kanał działa dokładnie tak, jak zaprojektowano — po prostu nie zna granic strukturalnych jednej ramy czasowej wyżej.
Rozwiązanie
Ten wskaźnik projektuje zakres Donchiana poprzedniego okresu wyższej ramy czasowej jako wizualne strefy na Twoim bieżącym wykresie. Gdy cena zbliża się do górnej lub dolnej linii standardowego kanału, od razu widzisz, czy zmierza w kierunku granicy wyższej ramy czasowej, czy od niej się oddala.
Strefy wyższej ramy czasowej dzielą bieżący okres na terytorium oporu (powyżej środka) i wsparcia (poniżej środka) — dając Ci strukturalne nastawienie jeszcze przed wystąpieniem wybicia.
GŁÓWNA KONCEPCJA
Tradycyjny Donchian odpowiada: "Jakie są najwyższe i najniższe ceny w ciągu ostatnich N świec?"
Ten wskaźnik dodaje: "Gdzie ten zakres znajduje się względem zakresu poprzedniego okresu wyższej ramy czasowej?"
System działa na dwóch warstwach:
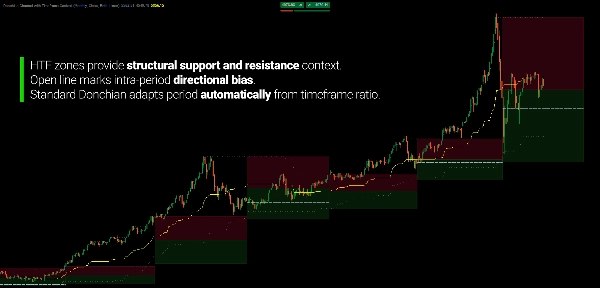
- Standardowy kanał Donchiana obliczany na Twoim bieżącym wykresie z automatycznie dostosowanym okresem. Okres jest wyprowadzany z proporcji między wybraną ramą czasową kontekstu a ramą czasową wykresu — nie wymaga ręcznego ustawiania. Kontekst tygodniowy na wykresie H1 automatycznie używa okresu 120 świec (5 dni × 24 godziny ÷ 1 godzina).
- Strefy kontekstu ram czasowych obliczają najwyższą i najniższą cenę z poprzedniego okresu wyższej ramy czasowej, a następnie projektują te poziomy jako kolorowe strefy na bieżącym okresie. Strefa wsparcia rozciąga się od dolnej granicy do środka. Strefa oporu rozciąga się od środka do górnej granicy.
Gdy standardowe wybicie Donchiana następuje w strefie wsparcia, kontekst wyższej ramy czasowej sugeruje, że ruch ma przestrzeń. Gdy następuje w strefie oporu, kontekst sugeruje ostrożność — wybicie napotyka na większy strukturalny podaż.
PRAKTYCZNE ZASTOSOWANIE
Filtrowanie fałszywych wybicia
Główne zastosowanie. Gdy cena przebija górną linię standardowego kanału, ale jest już głęboko w strefie oporu HTF, wybicie niesie większe ryzyko odwrócenia. Strefa dostarcza kontekst, by odróżnić prawdziwą ekspansję od wyczerpującego testowania podaży powyżej.
Z kolei wybicie, które następuje blisko środka HTF, ma więcej strukturalnej przestrzeni do rozwoju przed napotkaniem większej granicy.
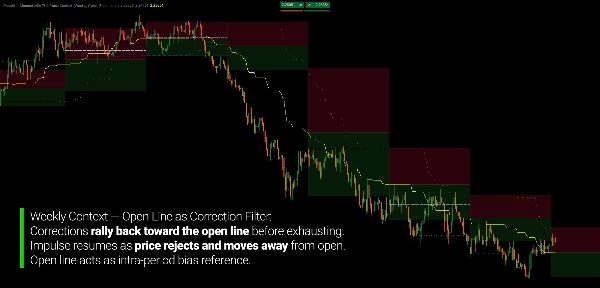
Wyczerpanie korekty
Podczas cofnięć w trendzie strefy wsparcia/oporu HTF dają Ci odniesienie strukturalne, gdzie korekta może się wyczerpać. Cofnięcie, które osiąga granicę strefy wsparcia HTF, sugeruje, że sprzedający mogli wyczerpać energię na poziomie strukturalnym — przygotuj się na potencjalne odwrócenie. Cofnięcie, które zatrzymuje się przed osiągnięciem strefy, sugeruje, że trend pozostaje silny.
Pozycjonowanie strukturalne
Przed wystąpieniem sygnału wybicia strefy pokazują, gdzie cena aktualnie znajduje się w zakresie wyższej ramy czasowej. Górna połowa zakresu HTF = ostrożność dla pozycji długich. Dolna połowa = ostrożność dla pozycji krótkich. Blisko środka = strefa neutralna, gdzie kierunek jest mniej określony.
Linia ceny otwarcia
Opcjonalna linia ceny otwarcia zaznacza, gdzie otworzył się bieżący okres wyższej ramy czasowej. Dostarcza dodatkowego odniesienia dla nastawienia wewnątrzokresowego — cena powyżej otwarcia sugeruje kontrolę byków, poniżej kontrolę niedźwiedzi.
KLUCZOWE CECHY
Dwuwarstwowy system Donchiana
- Standardowy kanał Donchiana z automatycznie obliczanym okresem na podstawie proporcji ram czasowych
- Strefy kontekstu wyższej ramy czasowej projektowane jako wsparcie/opór na bieżącym wykresie
- Obie warstwy aktualizują się w czasie rzeczywistym wraz z napływem nowych danych cenowych
Automatyczne obliczanie okresu
- Okres wyprowadzany z proporcji między ramą czasową kontekstu a ramą czasową wykresu
- Brak ręcznego ustawiania okresu — rama czasowa kontekstu definiuje okres patrzenia wstecz automatycznie
- Obsługuje wykresy nieoparte na czasie (Tick, Renko, Range) z konfigurowalną wartością domyślną
Opcje kontekstu ram czasowych
- 13 wyborów ram czasowych: od miesięcznej do 15-minutowej
- Stosuj kontekst tygodniowy na wykresie H1, dzienny na M5 lub dowolną ważną kombinację
- Strefy aktualizują się za każdym razem, gdy zaczyna się nowy okres wyższej ramy czasowej
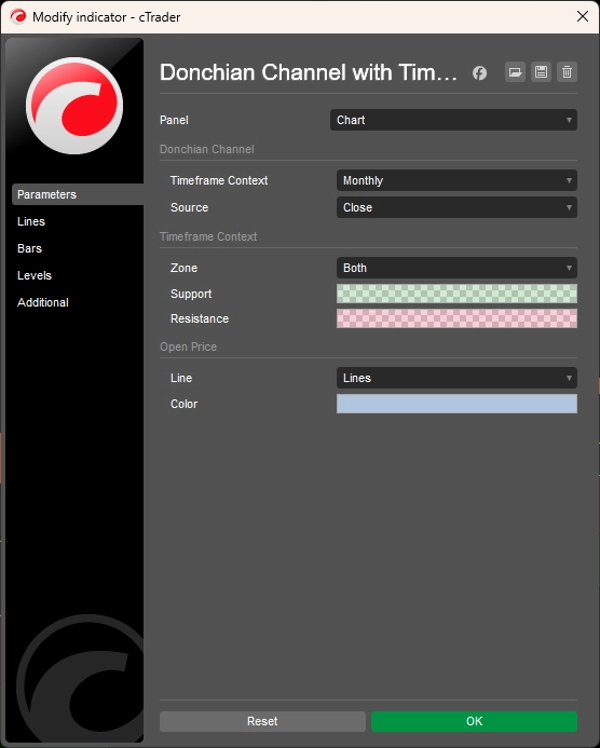
Wyświetlanie stref wizualnych
- Strefa wsparcia (od dolnej granicy do środka) — konfigurowalny kolor z przezroczystością
- Strefa oporu (od środka do górnej granicy) — konfigurowalny kolor z przezroczystością
- Tryby wyświetlania: obie strefy, tylko wsparcie, tylko opór lub brak
- Strefy projektują się do końca bieżącego okresu HTF
Linia ceny otwarcia
- Oznacza cenę otwarcia bieżącego okresu wyższej ramy czasowej
- Sześć opcji stylu linii: ciągła, kropki, rzadkie kropki, bardzo rzadkie kropki, linie, linie z kropkami
- Konfigurowalny kolor — lub całkowite wyłączenie
Elastyczność źródła ceny
- Obliczenia oparte na cenach zamknięcia: używa cen zamknięcia do granic kanału
- Obliczenia oparte na HighLow: używa knotów wysokich/niskich dla szerszych granic kanału
- Jedno ustawienie dotyczy zarówno obliczeń standardowych, jak i kontekstowych
JAK CZYTAĆ WYKRES
- Zielona strefa: Terytorium wsparcia — zakres dolny poprzedniego okresu HTF projektowany do przodu
- Czerwona strefa: Terytorium oporu — zakres górny poprzedniego okresu HTF projektowany do przodu
- Granica strefy (góra): Najwyższa cena poprzedniego okresu HTF
- Granica strefy (dół): Najniższa cena poprzedniego okresu HTF
- Środek strefy: Miejsce spotkania stref wsparcia i oporu — równowaga poprzedniego okresu
- Standardowe linie kanału: Górna/dolna/środkowa linia Donchiana bieżącej ramy czasowej
- Linia otwarcia: Miejsce otwarcia bieżącego okresu HTF
Ocena wybicia:
- Standardowe wybicie DO strefy wsparcia HTF → zgodne z trendem, przestrzeń strukturalna
- Standardowe wybicie DO strefy oporu HTF → przeciwnostrukturalne, wyższe ryzyko odwrócenia
- Standardowe wybicie POZA strefą HTF → nowe terytorium, poprzednia struktura już nie ogranicza ceny
DLA KOGO JEST TEN WSKAŹNIK
Ten wskaźnik jest przeznaczony dla traderów korzystających z kanałów Donchiana do handlu wybiciowego i chcących mieć kontekst strukturalny wyższej ramy czasowej do filtrowania swoich sygnałów.
Jeśli doświadczyłeś frustracji związanej z wchodzeniem w wybicia Donchiana, które natychmiast się odwracały — ponieważ napotykały na większą granicę strukturalną, której nie widziałeś — to narzędzie zapewnia tę widoczność.
Jest dobrze dopasowany do traderów podążających za trendem, którzy chcą obiektywnych kryteriów do rozróżniania prawdziwych wybicia od wyczerpujących testów podaży lub popytu powyżej. Analitycy wieloram czasowych skorzystają z widzenia kontekstu zakresu wyższej ramy czasowej bezpośrednio na wykresach wykonawczych bez przełączania ram czasowych.
Traderzy swingowi mogą używać stref HTF jako odniesienia strukturalnego dla wejść po cofnięciach — identyfikując, gdzie korekty prawdopodobnie się wyczerpią na podstawie granic poprzedniego okresu. Traderzy dyskrecjonalni zyskują dodatkową warstwę strukturalną dla kontekstu bez zwiększania złożoności wskaźnika.
To nie jest system sygnałowy. To nakładka kontekstowa, która pomaga ocenić wybicia Donchiana w ramach struktury rynku wyższej ramy czasowej.
CO GO WYRÓŻNIA
Standardowe wskaźniki kanału Donchiana działają na jednej ramie czasowej z ustalonym okresem. Mówią, kiedy cena przekracza ostatnie ekstremum — ale nic o tym, czy to ekstremum ma znaczenie strukturalne.
Ten wskaźnik wprowadza świadomość wyższej ramy czasowej bezpośrednio do ram Donchiana. Strefy kontekstu odpowiadają na pytania, na które standardowe kanały nie potrafią: Czy to wybicie naciska na strukturalną podaż? Czy to cofnięcie sięga strukturalnego popytu? Gdzie jestem w większym zakresie?
Automatyczne obliczanie okresu eliminuje powszechny problem niepokoju o parametry. Zamiast wybierać między 20, 50 czy 100 świecami patrzenia wstecz, okres wyprowadza się naturalnie z relacji ram czasowych. Kontekst tygodniowy na wykresie godzinowym automatycznie generuje właściwy okres patrzenia wstecz — bez potrzeby optymalizacji.
Efektem jest kanał Donchiana działający ze świadomością strukturalną, a nie w izolacji.
---
ZROZUMIENIE KONTEKSTU WIELORAM CZASOWYCH W HANDLU WYBICIOWYM
Handel wybiciowy jest prosty w koncepcji: cena przekracza granicę zakresu, sugerując zobowiązanie kierunkowe. Wyzwanie nie polega na identyfikacji wybicia — lecz na rozróżnieniu wybicia prowadzącego do trendu od wybicia, które natychmiast zawodzi.
Większość fałszywych wybicia ma wspólną cechę: występują na poziomie strukturalnie istotnym na wyższej ramie czasowej. Wybicie 15-minutowe do oporu tygodniowego nie jest wybiciem z perspektywy tygodniowej — to test znanej granicy.
Dlatego kontekst wieloram czasowych jest fundamentalny dla oceny wybicia. Wybicie samo w sobie następuje na Twojej ramie czasowej wykonania. Ale jego znaczenie jest określane przez to, gdzie występuje w strukturze wyższej ramy czasowej.
Wskaźniki dostarczające tego kontekstu nie przewidują, które wybicia odniosą sukces. Pomagają zrozumieć środowisko strukturalne, w którym każde wybicie następuje — dzięki czemu możesz dokładniej ocenić ryzyko i unikać pozycji walczących z większą strukturą.
Wyższa rama czasowa nie zastępuje niższej. Kontekstualizuje ją.
---
Trading wiąże się z ryzykiem. Ten wskaźnik jest narzędziem analizy technicznej — zawsze stosuj odpowiednie zarządzanie ryzykiem.


