
H Capital Liquidity Map Lite V1
Chỉ báo
252 lượt tải
Phiên bản 1.0, Mar 2026
Windows, Mac
Mô tả
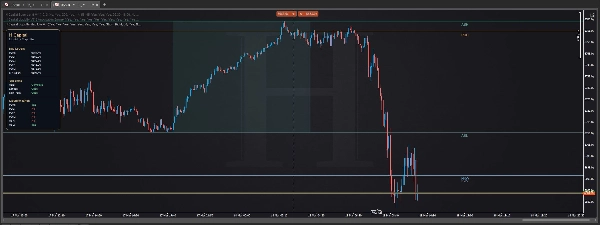
H Capital Liquidity Map Lite là một công cụ biểu đồ miễn phí được thiết kế cho các nhà giao dịch muốn có cấu trúc mà không bị rối mắt.
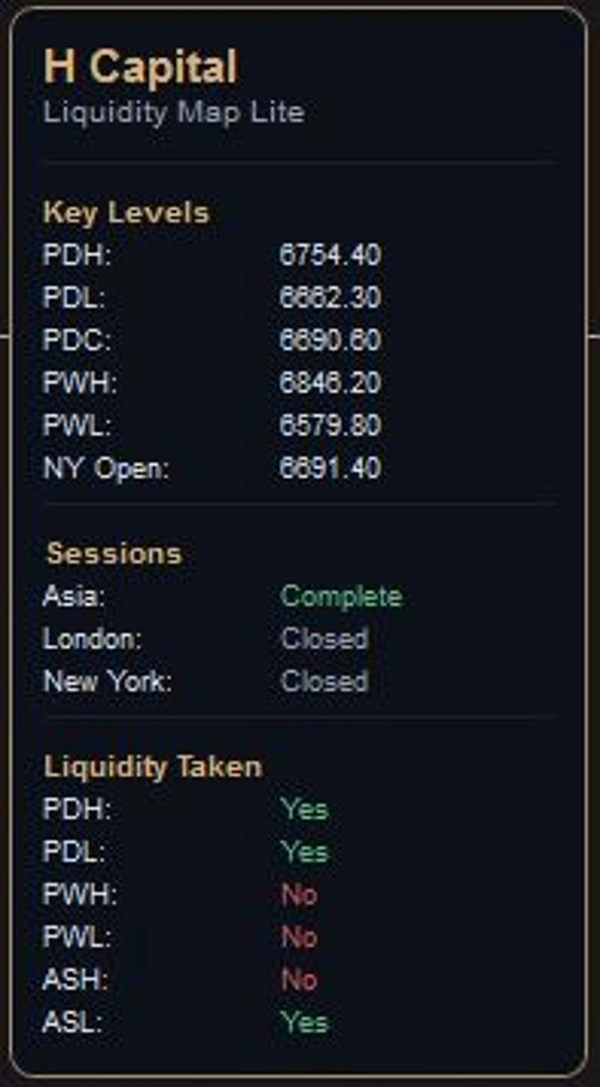
Nó lập bản đồ các tham chiếu thị trường chính mà nhiều nhà giao dịch theo dõi hàng ngày:
- đỉnh ngày trước
- đáy ngày trước
- đóng cửa ngày trước
- đỉnh tuần trước
- đáy tuần trước
- mở cửa New York
- phạm vi phiên châu Á
- trạng thái thanh khoản đã được lấy
Mục tiêu rất đơn giản: cung cấp cho các nhà giao dịch một khung làm việc sạch sẽ trước khi thực hiện.
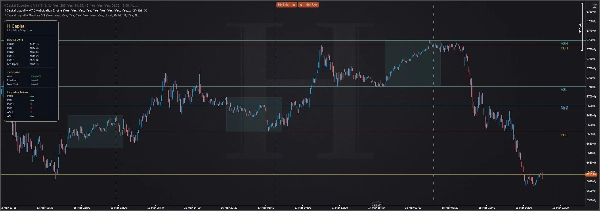
Thay vì làm đầy biểu đồ với các tín hiệu, H Capital Liquidity Map Lite tập trung vào các mức và tham chiếu phiên giúp xây dựng bối cảnh. Giao diện được thiết kế theo phong cách tối giản cao cấp để biểu đồ vẫn dễ đọc trong khi thông tin vẫn dễ tiếp cận ngay lập tức.
Phù hợp nhất cho:
- nhà giao dịch chỉ số
- nhà giao dịch forex
- nhà giao dịch kim loại
- nhà giao dịch dựa trên thanh khoản
- nhà giao dịch thích biểu đồ sạch
Những gì nó làm:
- lập bản đồ các mức thanh khoản hàng ngày và hàng tuần chính
- hiển thị cấu trúc phiên
- theo dõi xem các mức quan trọng đã bị lấy chưa
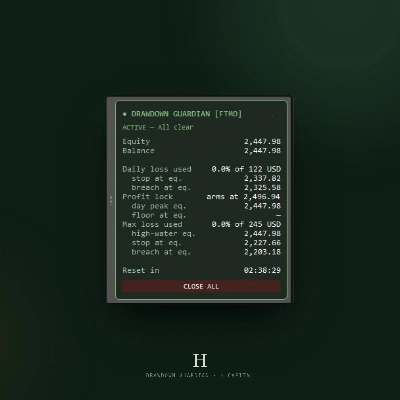
- giữ thông tin được tổ chức thông qua bảng điều khiển cao cấp trên biểu đồ
Những gì nó không làm:
- không tạo ra tín hiệu mua/bán
- không thay thế phán đoán thực thi
- không hoạt động như một công cụ cảnh báo
Đây không phải là công cụ tín hiệu. Đây là bản đồ thị trường chuyên nghiệp.
Tóm tắt
Tóm tắt AI
H Capital Liquidity Map Lite is a charting tool designed to provide traders with a clear, uncluttered view of key daily and weekly liquidity levels. It displays important market references such as the previous day’s high, low, and close; previous week’s high and low; New York open; Asia session range; and liquidity taken status. The tool organizes this information within a minimalist, premium on-chart panel to maintain readability and quick accessibility.
This indicator is suited for traders in indices, forex, metals, and those focusing on liquidity-based strategies who prefer clean chart layouts. It helps build market context by mapping session structures and tracking whether significant levels have been breached. The tool does not generate buy or sell signals, replace execution judgment, or function as an alert system. Instead, it serves as a professional market map to support informed trading decisions.
This indicator is suited for traders in indices, forex, metals, and those focusing on liquidity-based strategies who prefer clean chart layouts. It helps build market context by mapping session structures and tracking whether significant levels have been breached. The tool does not generate buy or sell signals, replace execution judgment, or function as an alert system. Instead, it serves as a professional market map to support informed trading decisions.
Hồ sơ chỉ báo
Đánh giá của khách hàng
0.0
Đánh giá: 0
Đánh giá của khách hàng
Sản phẩm này chưa có đánh giá nào. Bạn đã dùng thử chưa? Hãy là người đầu tiên chia sẻ với mọi người!
Thảo luận
Câu hỏi thường gặp
Prop
Forex
Indices
Commodities
Crypto
Grid
Các sản phẩm có sẵn trên cTrader Store, bao gồm bot giao dịch, chỉ báo và plugin, được cung cấp bởi các nhà phát triển bên thứ ba và chỉ nhằm mục đích cung cấp thông tin và tiếp cận kỹ thuật. cTrader Store không phải là nhà môi giới và không cung cấp lời khuyên đầu tư, khuyến nghị cá nhân hay bất kỳ đảm bảo nào về hiệu suất trong tương lai.
Sản phẩm khác của tác giả này


Giá
Kể từ 09/03/2026
1.58M
Khối lượng đã giao dịch
15.43K
Pip đạt được
252
Cài đặt miễn phí