Mô tả
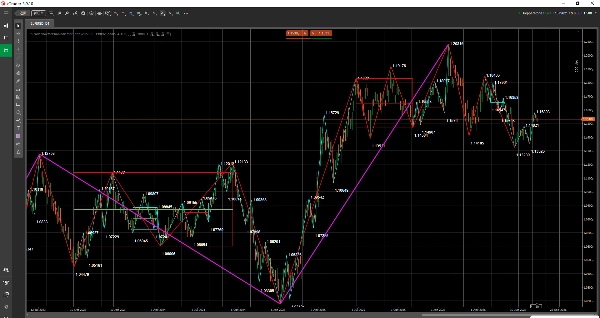
Chỉ báo Cấu trúc Boshi Chanlun cho cTrader là một chỉ báo phân tích kỹ thuật cấu trúc thị trường / phủ biểu đồ được sử dụng để hiển thị các cấu trúc Chanlun trên biểu đồ cTrader.
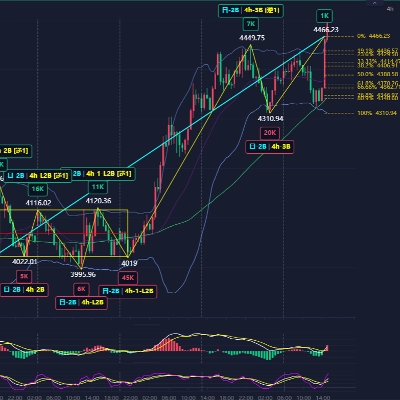
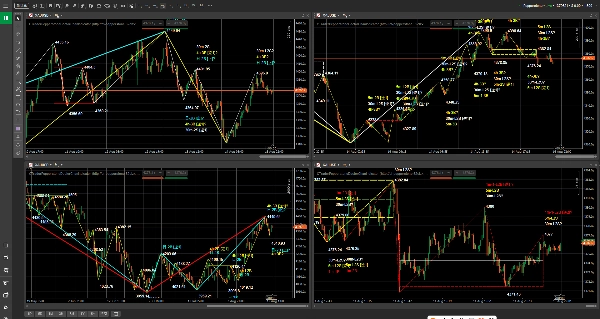
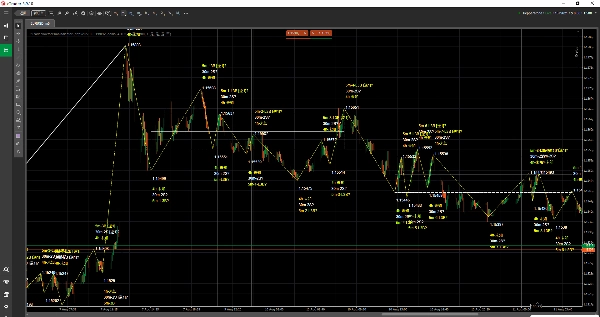
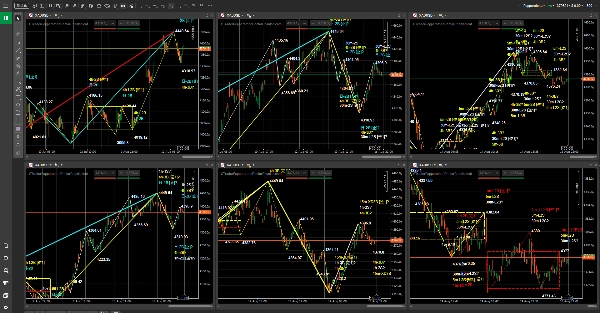
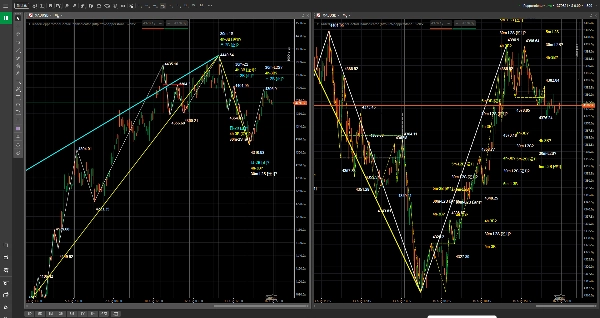
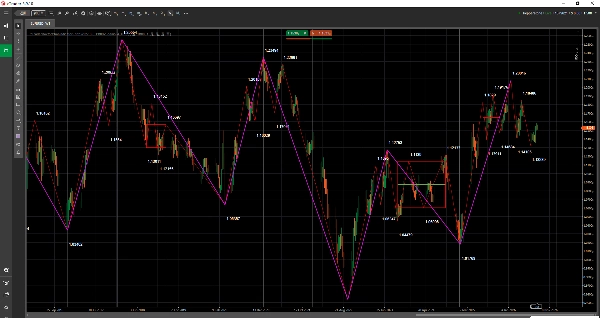
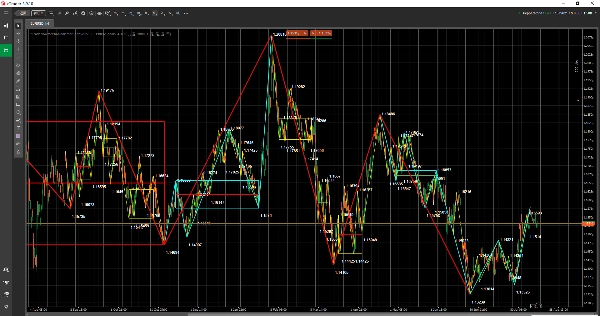
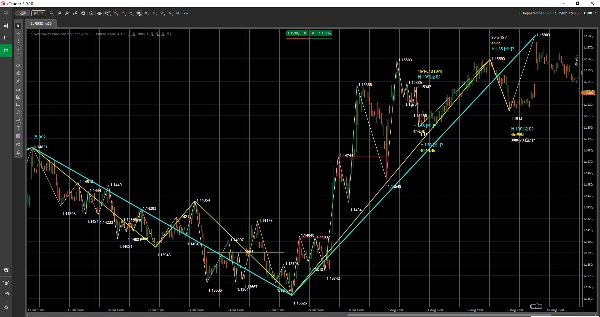
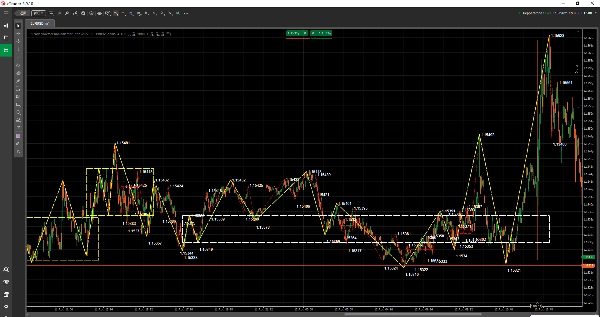
Nó phù hợp cho các nhà giao dịch tập trung vào hành động giá, cấu trúc xu hướng và phân tích đa khung thời gian. Chỉ báo hiển thị các cấu trúc Chanlun chính dưới dạng các đối tượng biểu đồ, bao gồm cấu trúc Bi, vùng Zhongshu, các dấu hiệu mua/bán và nhiều hơn nữa, giúp người dùng quan sát nhịp điệu thị trường, sự thay đổi cấu trúc và mối quan hệ giữa các khung thời gian khác nhau một cách trực quan hơn.
Chỉ báo này không phải là robot giao dịch tự động và không phải là dịch vụ tín hiệu giao dịch. Mục đích của nó là giúp người dùng đọc biểu đồ, xem xét thị trường và xây dựng kế hoạch giao dịch rõ ràng hơn.
Phiên bản hiện tại tương thích với các ký hiệu và khung thời gian cTrader Pepperstone được chỉ định. Sản phẩm này là một chỉ báo bên thứ ba độc lập và không phải là sản phẩm chính thức của Pepperstone hay sản phẩm đối tác của Pepperstone.
Tổng quan về chỉ báo
- Loại chỉ báo: chỉ báo cấu trúc thị trường / phủ biểu đồ.
- Công cụ ưu tiên: các ký hiệu Forex, chỉ số, hàng hóa, tiền điện tử và CFD cổ phiếu được chỉ định trong cTrader Pepperstone.
- Khung thời gian ưu tiên: 1 phút, 5 phút, 15 phút, 30 phút, 1 giờ, 4 giờ, hàng ngày, hàng tuần và hàng tháng.
- Trường hợp sử dụng giao dịch: quan sát cấu trúc biểu đồ, phân tích đa khung thời gian, hỗ trợ chuẩn bị và xem xét kế hoạch giao dịch.
Những gì bạn có thể thấy trên biểu đồ
- Cấu trúc Bi: dùng để quan sát nhịp dao động và tiến trình cấu trúc.
- Vùng Zhongshu: dùng để quan sát các khu vực hợp nhất quan trọng, cân bằng và chồng lấn cấu trúc.
- Dấu hiệu mua/bán: dùng để giúp xác định các điểm tham chiếu cấu trúc chính.
- Nhãn văn bản, đường ngang, đường dọc, khu vực hình chữ nhật, đường xu hướng và các đối tượng biểu đồ khác.
- Hỗ trợ tự động khớp dữ liệu với khung thời gian biểu đồ hiện tại theo mặc định, giúp quan sát đa khung thời gian dễ dàng hơn.
Ai là người dùng chỉ báo này
- Người dùng đang học hoặc sử dụng Chỉ báo Cấu trúc Boshi Chanlun và phân tích cấu trúc Chanlun.
- Người dùng muốn xem thông tin cấu trúc trực tiếp trên biểu đồ cTrader.
- Người dùng sử dụng Pepperstone để xem Forex, chỉ số, hàng hóa, tiền điện tử hoặc CFD cổ phiếu.
- Các nhà giao dịch cần so sánh cấu trúc xu hướng qua các khung thời gian khác nhau.
- Người dùng muốn làm rõ quy trình đọc biểu đồ, lập kế hoạch và xem xét.
Truy cập và cấp phép
Việc truy cập và cấp phép sản phẩm được quản lý thông qua quá trình mua, thử nghiệm và cài đặt trên cTrader Store. Vui lòng tham khảo trạng thái mua, trạng thái thử nghiệm và thông tin sản phẩm hiển thị trên trang sản phẩm cTrader Store.
Các ký hiệu Pepperstone được hỗ trợ hiện tại
Forex:
GBPUSD, EURUSD, USDJPY, USDCHF, AUDUSD, USDCAD, GBPJPY
Chỉ số:
US500, NAS100, GER40, UK100, JPN225, VIX, HSTECH
Hàng hóa:
XAUUSD, XAGUSD
Tiền điện tử:
BTCUSD, ETHUSD
Cổ phiếu:
AAPL.US-24, MSFT.US-24, GOOG.US-24, AMZN.US-24, TSLA.US-24, NVDA.US-24, META.US-24, NFLX.US-24, JPM.US-24
Khung thời gian được hỗ trợ
1 phút, 5 phút, 15 phút, 30 phút, 1 giờ, 4 giờ, hàng ngày, hàng tuần và hàng tháng.
Quy trình làm việc được đề xuất
1. Mở biểu đồ cho một ký hiệu được hỗ trợ trong môi trường cTrader Pepperstone.
2. Tải Chỉ báo Cấu trúc Boshi Chanlun lên biểu đồ.
3. Thời gian dữ liệu của Chỉ báo Cấu trúc Boshi Chanlun là UTC+0. Khi kiểm tra cấu trúc biểu đồ, hãy đảm bảo chuyển đổi múi giờ biểu đồ cTrader sang múi giờ tương ứng trước khi so sánh vị trí.
4. Đảm bảo khung thời gian biểu đồ hiện tại được hỗ trợ. Chỉ báo tự động khớp dữ liệu với khung thời gian biểu đồ.
5. Bật hoặc tắt "Hiển thị Bi", "Hiển thị Zhongshu" và "Hiển thị Mua/Bán" theo nhu cầu.
6. Quan sát cấu trúc biểu đồ cùng với kế hoạch giao dịch, quản lý vị trí và kiểm soát rủi ro của bạn.
Cài đặt tham số
Phiên bản hiện tại chỉ hiển thị 3 tham số có thể nhìn thấy sau trong bảng điều khiển chỉ báo cTrader. Khung thời gian dữ liệu, hậu tố ký hiệu nhà môi giới, bộ nhớ đệm, làm mới, truyền nén và cài đặt ghi nhật ký được quản lý nội bộ bởi chỉ báo và không cần cấu hình cho việc sử dụng bình thường.
Hiển thị Bi
Giá trị mặc định: "true"
Có hiển thị cấu trúc Bi hay không.
Hiển thị Zhongshu
Giá trị mặc định: "true"
Có hiển thị vùng Zhongshu hay không.
Hiển thị Mua/Bán
Giá trị mặc định: "true"
Có hiển thị các dấu hiệu mua/bán hay không.
Lưu ý quan trọng
- Sản phẩm này là chỉ báo trợ giúp phân tích kỹ thuật, không phải robot giao dịch tự động.
- Chỉ báo không tự động đặt lệnh.
- Chỉ báo không cấu thành lời khuyên đầu tư, dịch vụ tín hiệu giao dịch hay đảm bảo lợi nhuận.
- Phiên bản hiện tại chỉ tương thích với các ký hiệu cTrader Pepperstone được chỉ định và các khung thời gian được chỉ định.
- Thời gian dữ liệu của Chỉ báo Cấu trúc Boshi Chanlun là UTC+0. Khi hiển thị trên biểu đồ cTrader, vui lòng chuyển sang múi giờ biểu đồ tương ứng trước khi kiểm tra vị trí cấu trúc.
- Người dùng nên sử dụng nó cùng với kế hoạch giao dịch, quản lý vị trí, kiểm soát rủi ro và phán đoán độc lập của riêng mình.
Hướng cập nhật tương lai
Phiên bản phát hành hiện tại ưu tiên các ký hiệu và khung thời gian cTrader Pepperstone được chỉ định. Các bản cập nhật trong tương lai có thể tiếp tục mở rộng thêm nhiều nhà môi giới, nhiều ánh xạ ký hiệu hơn và phạm vi dịch vụ dữ liệu hoàn chỉnh hơn theo kế hoạch sản phẩm.
Cảnh báo rủi ro
Giao dịch trên thị trường tài chính có rủi ro. Hiệu suất trong quá khứ không đảm bảo kết quả trong tương lai. Chỉ báo này chỉ là công cụ trợ giúp phân tích kỹ thuật và học tập. Nó không cấu thành lời khuyên đầu tư, dịch vụ tín hiệu giao dịch hay đảm bảo lợi nhuận. Các cấu trúc lịch sử không đại diện cho kết quả tương lai. Người dùng nên kiểm tra kỹ trong môi trường giao dịch của riêng mình và sử dụng cẩn thận cùng với các quy tắc quản lý rủi ro.
Tóm tắt
Compatible with selected Forex pairs (e.g., GBPUSD, EURUSD), indices (e.g., US500, NAS100), commodities (XAUUSD, XAGUSD), cryptocurrencies (BTCUSD, ETHUSD), and major US stock CFDs (e.g., AAPL, MSFT, TSLA), it automatically matches data to the current chart timeframe. Users can toggle the display of Bi structures, Zhongshu zones, and buy/sell markers via simple parameters.
This indicator serves as a chart reading and market review assistant, not an automated trading system or signal provider. It requires users to apply their own trading plans, risk management, and judgment. Data time is based on UTC+0, so chart time zone adjustments are necessary for accurate structure positioning. Access and licensing are managed through the cTrader Store.
Đánh giá của khách hàng
5 | 0 % | |
4 | 100 % | |
3 | 0 % | |
2 | 0 % | |
1 | 0 % |