
설명
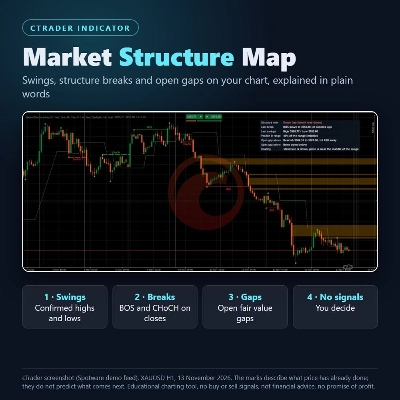
Market Structure Map draws the structure of your chart and explains it in a small panel. It does not place trades and it gives no buy or sell signals.
WHAT IT SHOWS
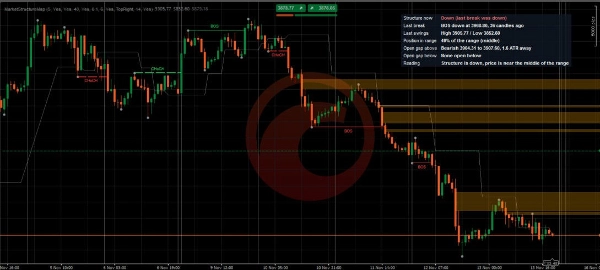
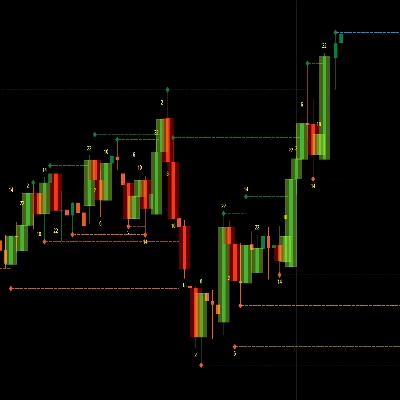
- Confirmed swing highs and lows (marked after 5 more candles, then they never move).
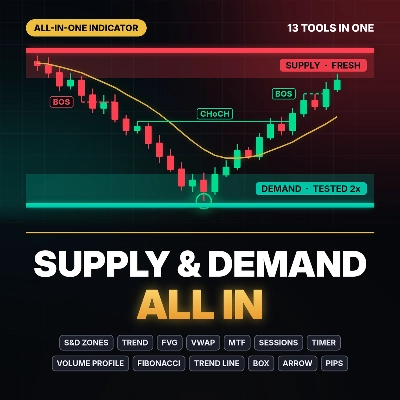
- BOS lines: a candle closed beyond the last swing in the direction of the current structure. CHoCH lines (dashed): the first close beyond the last swing against it. Decided on closed candles only; a wick is not a break.
- Open fair value gaps as boxes; a box disappears once price trades through its far edge.
- A 50% line of the current swing range (premium above it, discount below, in plain words).
- A panel: structure now, last break, last swings, position in the range, nearest open gap above and below with its distance in ATR, and a one-line reading.
SETTINGS
Swing length, show swings / breaks / gaps, how many recent breaks to draw, smallest gap (x ATR), most open gaps, ATR length, panel position, popup alerts.
LIMITS
- Checked in cTrader 5.10.22 (Spotware demo) on the XAUUSD and EURUSD 1-hour charts. Other brokers, symbols and timeframes were not tested. Popup alerts were not tested live.
- Marks describe what price has already done. They do not predict what comes next, and a break or a gap can fail.
- Educational charting tool. Not financial advice, not a signals service, no promise of profit. Trading is risky and you can lose money.
SETUP
Add it to a chart; it draws on the price chart. Change the swing length in the settings to get more or fewer swings.
요약
상담
고객 리뷰
자주 묻는 질문(FAQ)
이 작성자의 상품 더 보기




가격
