Mô tả
Giải Thích Chiến Lược Theo Xu Hướng Forex (Tiếng Anh)
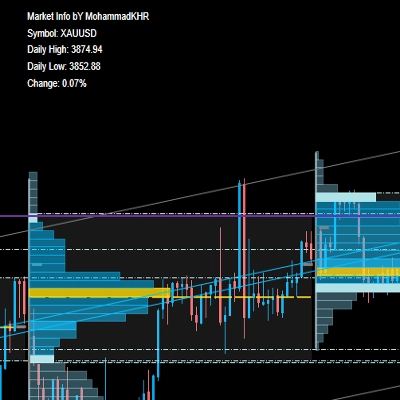
Chiến lược theo xu hướng này được thiết kế để xác định xu hướng thị trường mạnh bằng cách sử dụng Đường Trung Bình Động Lũy Thừa (EMA), MACD và ADX. Nó tạo ra tín hiệu mua và bán dựa trên động lượng và sức mạnh xu hướng.
Cách Hoạt Động
1️⃣ Xác Định Hướng Xu Hướng
- EMA Nhanh (21) và EMA Chậm (50) xác định hướng xu hướng tổng thể:
-
- Xu Hướng Tăng → EMA Nhanh nằm trên EMA Chậm
- Xu Hướng Giảm → EMA Nhanh nằm dưới EMA Chậm
2️⃣ Đo Động Lượng Xu Hướng (Biểu Đồ MACD)
- Biểu đồ MACD xác nhận động lượng:
-
- Động Lượng Tăng → Biểu đồ MACD nằm trên 0
- Động Lượng Giảm → Biểu đồ MACD nằm dưới 0
3️⃣ Kiểm Tra Sức Mạnh Xu Hướng (Chỉ Báo ADX)
- Chỉ báo ADX (14) đo sức mạnh xu hướng:
-
- Xu Hướng Mạnh → ADX nằm trên 25
- Xu Hướng Yếu → ADX nằm dưới 25 (không có tín hiệu)
Thực Hiện Giao Dịch
✅ Tín Hiệu Mua (Vào Lệnh Tăng)
- EMA Nhanh > EMA Chậm (Xu hướng tăng)
- Biểu Đồ MACD > 0 (Xác nhận động lượng)
- ADX > 25 (Xu hướng mạnh)
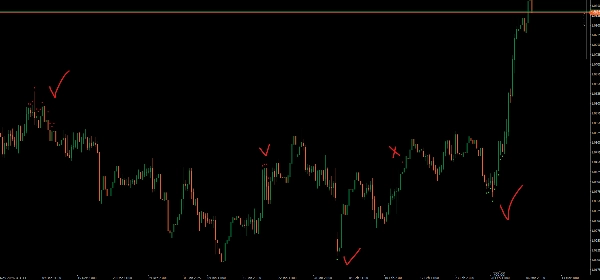
- 🔹 Mũi tên mua xuất hiện dưới giá thấp
❌ Tín Hiệu Bán (Vào Lệnh Giảm)
- EMA Nhanh < EMA Chậm (Xu hướng giảm)
- Biểu Đồ MACD < 0 (Xác nhận động lượng)
- ADX > 25 (Xu hướng mạnh)
- 🔻 Mũi tên bán xuất hiện trên giá cao
Các Tính Năng Chính
✔ Tránh các xu hướng yếu bằng cách sử dụng ADX
✔ Lọc các tín hiệu sai với xác nhận MACD
✔ Tham số có thể điều chỉnh để tùy chỉnh tốt hơn
Chỉ báo này giúp các nhà giao dịch bắt kịp các xu hướng mạnh trong khi tránh các điều kiện thị trường yếu. 🚀