说明
⚠️ 我们已迁移至 👉 PrimeQuant
🚫🚫🚫 请勿购买此指标!
这个 OHLC PRO by LudwigICT 指标是一个 多功能图表叠加工具,旨在为您的 cTrader 图表提供专业且信息丰富的可视化效果。
以下是它的功能简介:
🔹 核心功能:OHLC 叠加
- 在您的图表上绘制 自定义 OHLC(开盘价、高价、低价、收盘价)柱。
- 您可以设置:
-
- 使用哪个时间框架的 OHLC(日线、周线、月线,或如 H1、M15 等盘中时间)。
- 柱偏移量(与当前蜡烛的距离)。
- 柱宽、影线、边框和自定义颜色。
- 实际上,您会获得来自更高时间框架的 “参考蜡烛”,显示在当前图表上。
🔹 Triple-M 设置(看涨/看跌信号)
- 检测 连续更高低点(看涨)或 更低高点(看跌)的模式。
- 检测到时:
-
- 可以在蜡烛上放置 三角形图标(向上或向下)。
- 也可以 重新着色柱子以显示动量变化。
- 这相当于一个 动量结构转变信号。
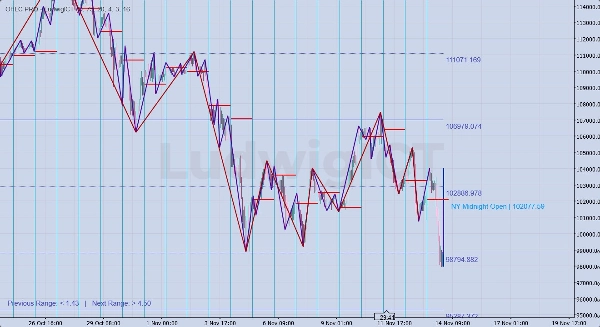
🔹 双重 ZigZag 工具
- 两个独立的 ZigZag 叠加:
-
- ZigZag #1(较长周期,例如波段结构)。
- ZigZag #2(较短周期,例如微波段)。
- 突出显示市场波动,用于 结构、趋势和突破分析。
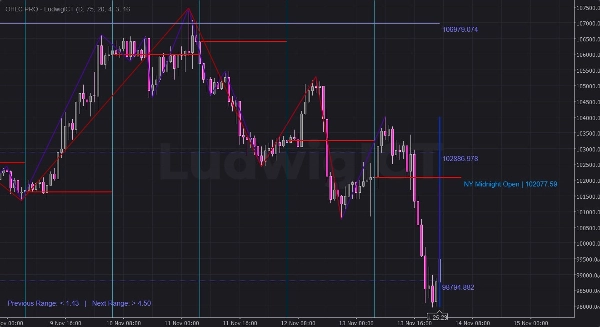
🔹 甘恩支撑与阻力
- 使用 甘恩数字表+ ATR 逻辑计算支撑/阻力水平。
- 绘制多个价格上下的支撑/阻力线。
- 线条可设样式(实线、点线、向左延伸等)。
- 标注价格值。
- 还提供 区间指南:
-
- 相对于 ATR 的“前一区间”与“下一区间”。
- 帮助预测扩张或收缩区域。
🔹 纽约午夜价位
- 自动检测 纽约交易时段午夜开盘价。
- 绘制:
-
- 水平线于纽约午夜开盘价。
- 垂直线于交易时段开始。
- 标签显示“NY Midnight Open | 价格”。
- 您可以将这些线延长 1 或 2 天,或增加额外小时数。
- 适用于 ICT 风格交易(纽约时段偏向、均衡点等)。
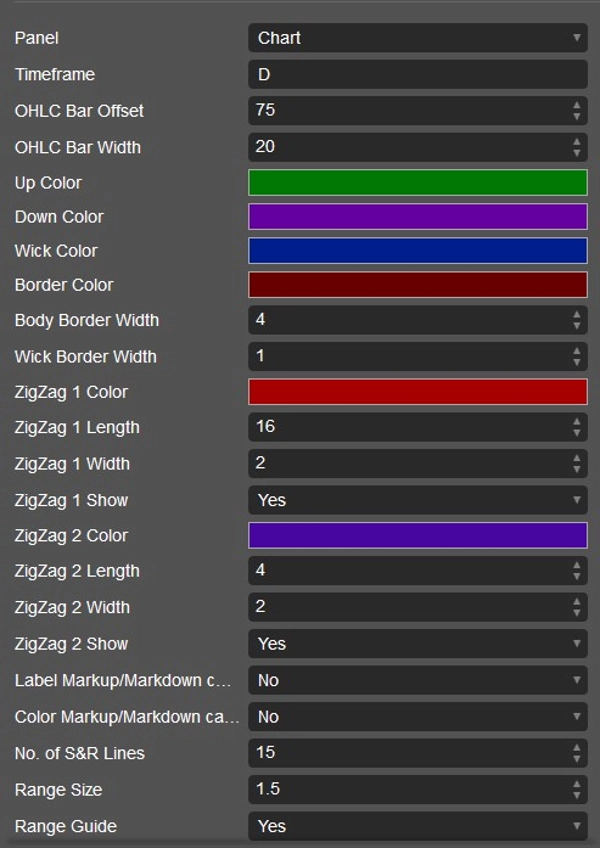
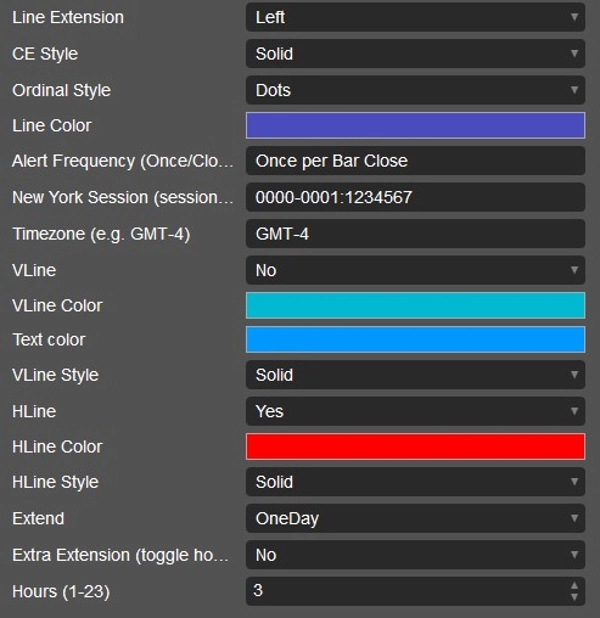
🔹 自定义与提醒
- 每个功能都有 下拉菜单参数:
-
- 颜色、样式、线条延伸、线条数量等。
- 支持提醒(主要通过图表视觉,提醒频率参数可调)。
- 关闭指标时会干净移除,避免图表杂乱。
✅ 简而言之:
此指标是一个 多用途价格行为工具。它结合了:
- 更高时间框架的 OHLC 蜡烛
- 动量模式信号(Triple-M)
- 两个 ZigZag 结构
- 甘恩支撑/阻力水平 + 区间指南
- 纽约时段午夜开盘标记
它专为 结构、时段和基于水平的交易设计,特别适合 ICT 风格或价格行为交易者。
我将解释 如何在交易 XAU/USD 时实际使用它
🔹 实际交易应用(使用 OHLC PRO 的黄金)
1. 更高时间框架 OHLC 叠加
- 示例:在 M5/M15 交易时绘制 日线 OHLC。
- 您会看到昨天的蜡烛“嵌入”您的盘中图表中。
- 用法:
-
- 价格接近 前一日高/低点 = 流动性狩猎区。
- 日开盘/收盘 = 偏向过滤器(高于为看涨,低于为看跌)。
- 帮助您在 日内区间内交易。
👉 在黄金上,纽约时段经常冲击 前一日高/低点后反转。
2. Triple-M 信号
- Triple-M 模式(一系列上升低点或下降高点)= 短期动量。
- 用法:
-
- 看涨 Triple-M 靠近 支撑(高时间框架低点或纽约午夜开盘) → 可能的多头短线。
- 看跌 Triple-M 靠近 阻力(高时间框架高点或甘恩水平) → 可能的空头短线。
- 可为快速黄金波动着色柱子,便于快速视觉识别。
👉 适合 狙击入场,在 M1–M5 时间框架与高时间框架偏向一致时效果佳。
3. 双重 ZigZag
- ZigZag #1(较长周期)= 波段结构。
- ZigZag #2(较短周期)= 微观结构。
- 用法:
-
- 识别 市场结构突破(BOS/CHOCH)。
- 仅按较大 ZigZag (#1) 方向交易。
- 用较小 ZigZag (#2) 确认入场。
👉 示例:日线偏向看涨 → 等待 ZigZag #2 在高时间框架支撑附近转为看涨。
4. 甘恩支撑与阻力
- 生成一张 数学支撑/阻力水平网格。
- 用法:
-
- 如果价格盘整,水平标记可能的扩张突破点。
- 结合 ATR 区间指南:
-
- “前一区间”小 → 预期波动性扩张。
- “下一区间”高 → 前方强突破水平。
👉 在黄金上,甘恩水平常与整数位对齐(如 2400、2420、2435)。
5. 纽约午夜开盘价
- 这是 黄金最强大的 ICT 工具之一。
- 用法:
-
- 价格相对于纽约午夜开盘价 = 方向偏向。
- 如果价格保持 在午夜开盘价之上 → 纽约时段看涨。
- 如果低于 → 看跌偏向。
- 水平线作为 均衡(50%)参考。
- 关注伦敦/纽约关键时段围绕此水平的流动性扫荡。
👉 示例:
纽约午夜开盘价 = 2405。
- 如果伦敦将价格压低至 2398,而纽约重新夺回 2405 → 强劲多头设置。
🔑 综合应用(示例设置)
- 纽约时段开始:
-
- 绘制 日线 OHLC。
- 注意 纽约午夜开盘价。
- 关注附近的甘恩水平。
- 等待 流动性捕捉(冲击日高/低或甘恩支撑/阻力)。
- 检查 Triple-M / ZigZag #2以确认微观看涨/看跌信号。
- 在流动性扫荡后设置止损入场。
- 目标为区间对侧或下一个甘恩/高时间框架水平。
✅ 简而言之:
- 日线 OHLC + 纽约午夜 = 偏向过滤器。
- ZigZag + Triple-M = 入场时机。
- 甘恩 + 区间指南 = 盈利目标与扩张信号。
此指标基本上为您提供了 所有 ICT 风格工具的整合包,适用于 XAU/USD。
如果您有任何问题或遇到任何问题,欢迎随时联系我。我很乐意帮助您!
免责声明:
使用我的算法即表示您承认交易存在固有风险,过去的表现不保证未来结果。您必须具备稳健的风险管理策略,最重要的是严格遵守止损水平。风险管理不当可能导致重大损失。我不对使用这些算法产生的任何财务结果负责。请负责任地交易,并始终遵循适当的风险管理实践。
祝福! 🙌
摘要
客户评价
5 | 100 % | |
4 | 0 % | |
3 | 0 % | |
2 | 0 % | |
1 | 0 % |


