คำอธิบาย
แผงข้อมูลแท่ง: ข้อมูลโฮเวอร์ที่ตั้งค่าได้ทันทีสำหรับแท่งใดก็ได้
ภาพรวม
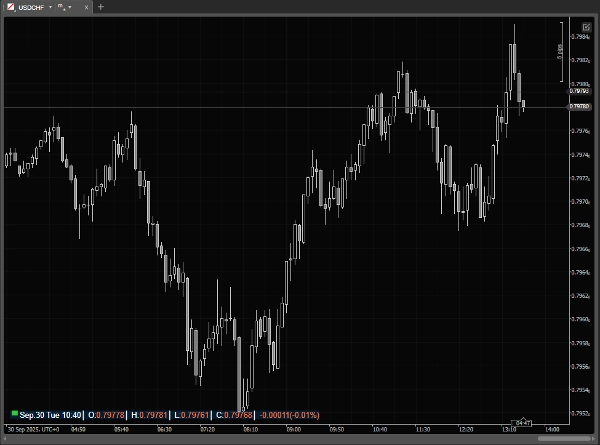
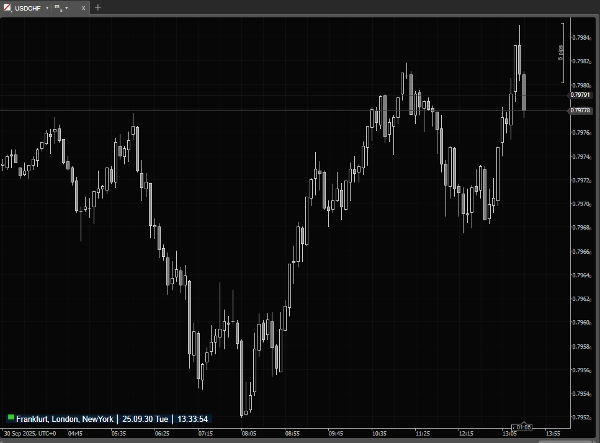
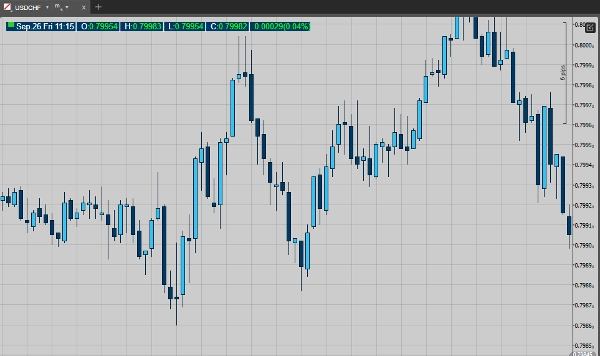
แผงข้อมูลแท่งเป็นโอเวอร์เลย์ cTrader ที่น้ำหนักเบาซึ่งให้ข้อมูลที่แม่นยำทันทีเกี่ยวกับแท่งใดก็ได้บนแผนภูมิ เมื่อเมาส์ของคุณอยู่นอกแผนภูมิ จะแสดงบรรทัดสถานะขนาดกะทัดรัดพร้อมช่วงเวลาตลาดปัจจุบันและเวลาของเซิร์ฟเวอร์/ท้องถิ่น/UTC
cTrader มีข้อมูลแท่งอยู่แล้ว แต่มีเฉพาะใน แถบสถานะ ของหน้าต่างหลักเท่านั้น - หมายความว่าไม่สามารถมองเห็นได้เมื่อคุณใช้แผนภูมิแยก นอกจากนี้ยังไม่สามารถปรับแต่งได้และฟอนต์ขนาดเล็กมักทำให้อ่านได้ยากอย่างรวดเร็ว แผง ข้อมูลแท่ง แก้ไขปัญหาเหล่านี้โดยนำโอเวอร์เลย์ที่ชัดเจนและปรับแต่งได้เต็มรูปแบบมาที่แผนภูมิโดยตรง
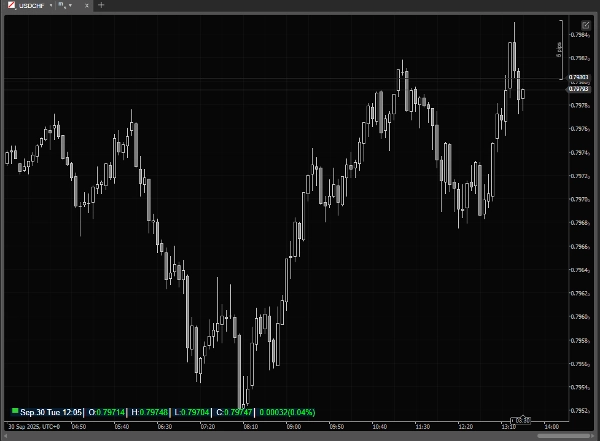
เลื่อนเมาส์ไปบนแท่งและแผงจะขยายเพื่อแสดงวันที่ เวลา เปิด สูง ต่ำ ปิด ปริมาณแท็ก และ (ถ้าต้องการ) เปอร์เซ็นต์การเปลี่ยนแปลงเทียบกับแท่งก่อนหน้า องค์ประกอบภาพและการจัดวางทั้งหมดสามารถปรับแต่งได้เพื่อให้แผงเหมาะกับเวิร์กโฟลว์และธีมแผนภูมิของคุณ
คุณสมบัติหลัก
· ตัวบ่งชี้ช่วงเวลาตลาด + เวลาปัจจุบันแบบสด (ท้องถิ่น / เซิร์ฟเวอร์ / UTC)
· แผงโฮเวอร์ที่แสดงวันที่ เวลา O/H/L/C และปริมาณแท็กของแท่งที่โฮเวอร์
· การแสดงเปอร์เซ็นต์การเปลี่ยนแปลงที่เลือกได้ (ปัจจุบันเทียบกับแท่งก่อนหน้า)
· โหมดการแสดงผลสองแบบ: กะทัดรัด (เมาส์อยู่นอก) และละเอียด (เมาส์อยู่บนแผนภูมิ)
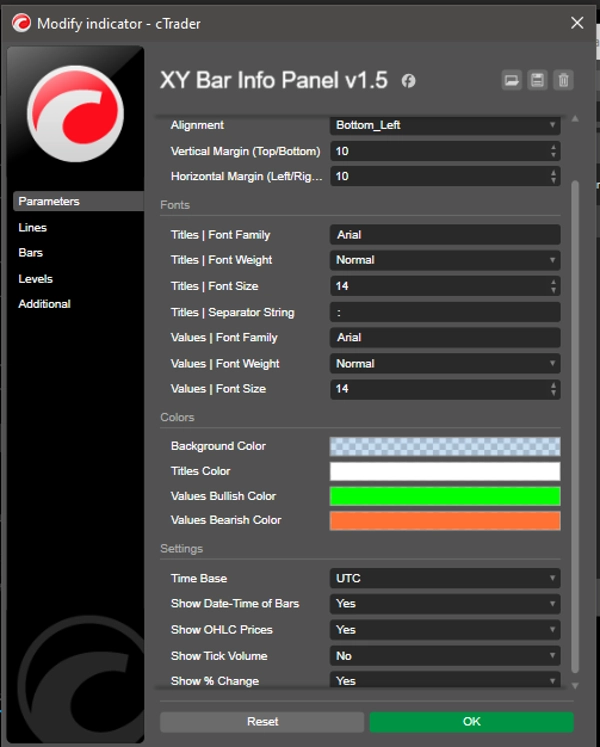
· ตัวเลือกการวางตำแหน่งเก้ารูปแบบ + ขอบพิกเซลสำหรับการเลื่อนแนวตั้งและแนวนอน
· การควบคุมฟอนต์แยกต่างหากสำหรับหัวข้อ (ป้ายกำกับ) และค่า (ครอบครัว น้ำหนัก ขนาด)
· สตริงตัวคั่นหัวข้อสำหรับการติดป้ายแบบกะทัดรัด
· สีที่ปรับแต่งได้: พื้นหลังแผง สีหัวข้อ สีค่าขาขึ้น (บูลลิช) และค่าขาลง (แบร์ริช)
กรณีการใช้งาน
· อ่านค่า OHLC และเวลาที่แม่นยำสำหรับแท่งประวัติหรือแท่งสดได้อย่างรวดเร็วโดยไม่ต้องใช้ crosshair ด้วยตนเอง
· ตรวจสอบปริมาณแท็กและเปอร์เซ็นต์การเปลี่ยนแปลงขณะสแกนการเคลื่อนไหวราคา
· ตรวจสอบสถานะช่วงเวลาตลาดและเวลาของเซิร์ฟเวอร์/ท้องถิ่น/UTC ได้อย่างรวดเร็ว
· เตรียมภาพหน้าจอแผนภูมิหรือวัสดุการศึกษาโดยใช้ข้อมูลแท่งที่สม่ำเสมอและอ่านง่าย
· ...
ทำไมเทรดเดอร์ถึงชอบมัน
แตกต่างจากแถบสถานะในตัวของ cTrader (ซึ่งถูกตรึงไว้ที่ด้านล่างของหน้าต่างหลัก หายไปในแผนภูมิแยก และใช้ฟอนต์ขนาดเล็กที่ไม่สามารถปรับแต่งได้) แผงข้อมูลแท่ง จะมองเห็นได้เสมอตรงที่คุณต้องการ ด้วยฟอนต์ สี และการจัดวางที่ชัดเจน ช่วยประหยัดเวลาเมื่อเทียบกับการอ่านแถบสถานะหรือค่าข้ามเส้นด้วยตนเอง รักษาความสะอาดของแผนภูมิของคุณ และให้ข้อมูลที่คุณต้องการอย่างแม่นยำในพริบตา น้ำหนักเบาและตอบสนองได้ดี ออกแบบมาเพื่อการใช้งานทุกวันโดยไม่ทำให้แพลตฟอร์มของคุณช้าลง
สรุป
รีวิวจากลูกค้า
5 | 100 % | |
4 | 0 % | |
3 | 0 % | |
2 | 0 % | |
1 | 0 % |