说明
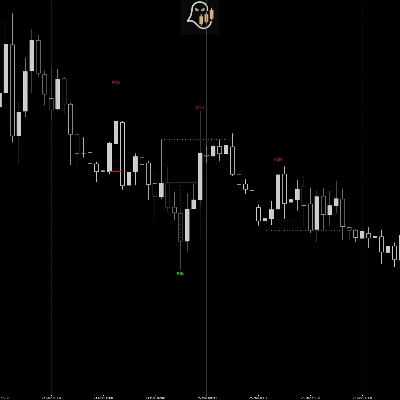
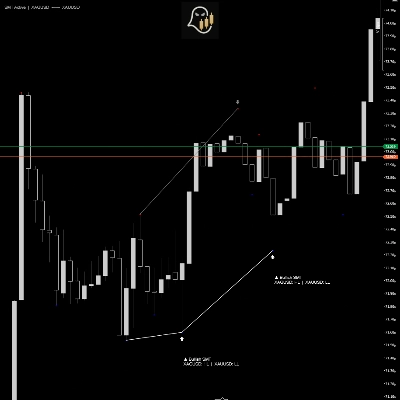
该指标检测由MSS(市场结构转变)模式构成,基于分形高点和低点。
有效的MSS需要:
- 一系列4个分形摆动点
- 突破之前的摆动结构
- 反方向确认
- 可选的4小时偏向确认
检测到时,指标提供:
- 可视化模式线
- 斐波那契入场水平(50%)
- 图表上的警报面板
- 可选声音警报
- 偏向方向显示
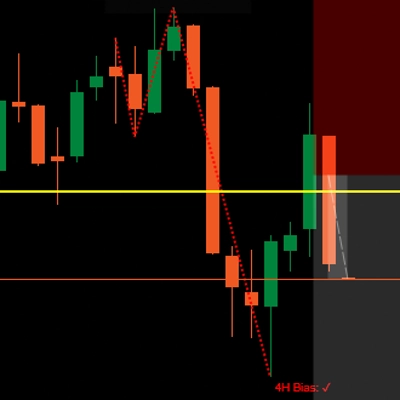
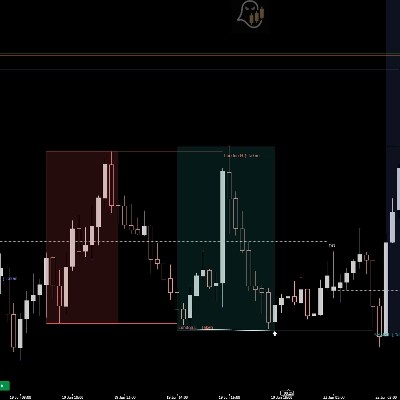
4小时偏向过滤器
启用时,指标使用之前的4小时蜡烛过滤信号。
- 看涨4小时蜡烛 → 仅显示看涨MSS
- 看跌4小时蜡烛 → 仅显示看跌MSS
这防止了与更高时间框架的动量交易相反。
偏向每隔几分钟自动更新并显示在图表上。
斐波那契入场水平
检测到MSS后,指标计算:
最后两个摆动点之间的50%回撤
该水平代表:
- 机构重新进入区域
- 最佳回调区域
- 风险效率高的入场价格
该水平以水平线绘制。
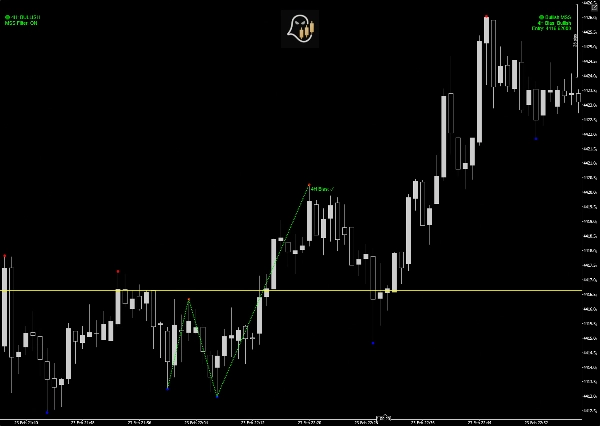
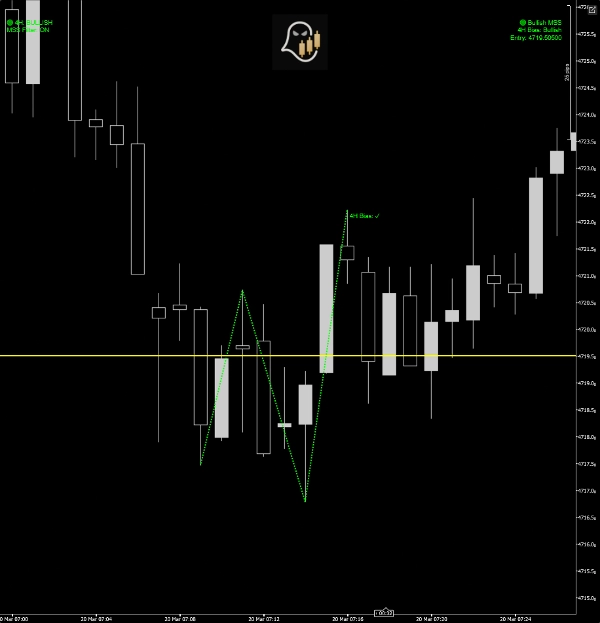
视觉输出
当形成模式时,指标显示:
✔ 模式线
视觉连接摆动点
✔ 斐波那契50%水平
图表上突出显示入场区域
✔ 偏向显示面板
显示当前4小时方向偏向
✔ MSS警报面板
显示活动信号和入场水平
✔ 声音警报(可选)
输入参数
分形周期
控制摆动灵敏度。
- 较低值 → 更多信号
- 较高值 → 仅强摆动
使用4小时偏向过滤器
基于更高时间框架过滤信号。
推荐:开启
显示MSS警报
在图表上显示信号文本。
警报声音
MSS形成时播放通知。
绘制模式线
在图表上显示视觉结构。
如果只想要警报,请禁用。
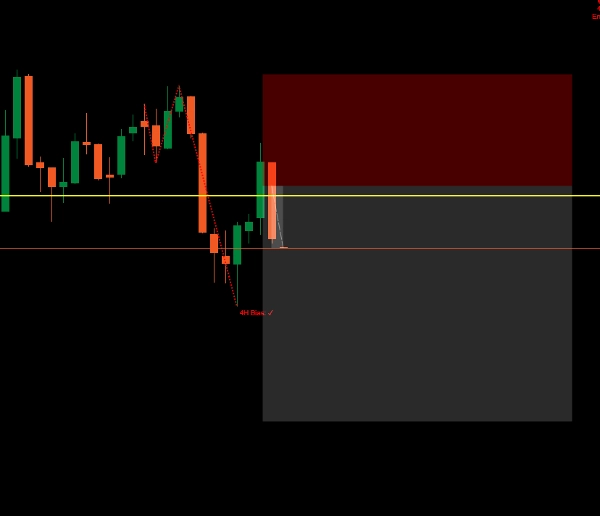
如何使用该指标交易
步骤1
等待MSS检测。
步骤2
确认偏向一致性。
步骤3
标记50%斐波那契水平。
步骤4
等待价格回撤至该区域。
步骤5
按MSS方向入场。
摘要
指标配置
客户评价
4.5
评价:2
5 | 50 % | |
4 | 50 % | |
3 | 0 % | |
2 | 0 % | |
1 | 0 % |
客户评价
March 9, 2026
the setup improves when it makes the setup easier to question, and the first test should keep DD under 3 percent.
February 26, 2026
The first reaction should not be the only input, but clean zones can still fail.
讨论
常见问答
Forex
Scalping
Indices
Commodities
SMC
cTrader Store 提供的所有产品,包括交易机器人、指标和插件,均由第三方开发者提供,仅供信息参考和技术访问之用。cTrader Store 并非经纪商,不提供投资建议、个人推荐或任何未来业绩保证。
该作者的其他作品

猜您喜欢


!["[Hamster-Coder] Pivot Points MTF" 标识](https://cdn.ctrader.com/image/webp/4c143e5a-309c-40e3-a578-f04d1e133ffa_31159)
价格
2
销售