

KasePeakOscillator
インジケーター
91 ダウンロード数
バージョン 1.0、May 2026
Windows、Mac
5.0
レビュー: 4
登録日 21/02/2025
466.3M
取引数量
180.83K
獲得pips
26
販売
7.43K
無料インストール
説明
The KasePeakOscillator (KPO) は、市場の疲弊、トレンドの反転、およびモメンタムの変化を特定するために設計された高度なテクニカル分析ツールです。標準的なオシレーターとは異なり、KPOは統計的なボラティリティの測定を統合し、さまざまな市場状況でより信頼性の高いシグナルを提供します。
仕組み: インジケーターは価格の動きと過去のボラティリティ(平均日間レンジ/標準偏差)との関係を計算します。「短期サイクル」と「長期サイクル」を比較して、価格の動きが統計的に有意か単なる市場のノイズかを判断します。その結果、ゼロラインの周りで振動する滑らかで反応の良いオシレーターが得られます。
主な構成要素:
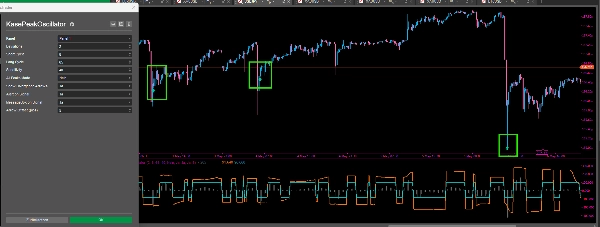
- ヒストグラム(KCD): コアのモメンタムを表します。ゼロラインのクロスは短期トレンドのバイアスの変化を示します。
- ダイナミックバンド(上部/中間): これらは統計的な「買われ過ぎ」および「売られ過ぎ」の閾値として機能します。市場のボラティリティに適応し、活動が活発な期間には拡大し、統合期間には収縮します。
- 自動ピーク検出: インジケーターはモメンタムが統計的な極値に達する「ピーク」と「ロー」を識別し、潜在的な疲弊を示します。
トレーディング戦略:
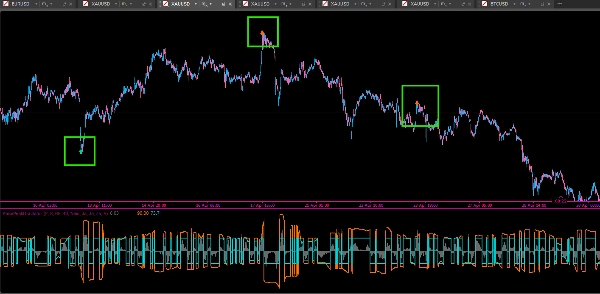
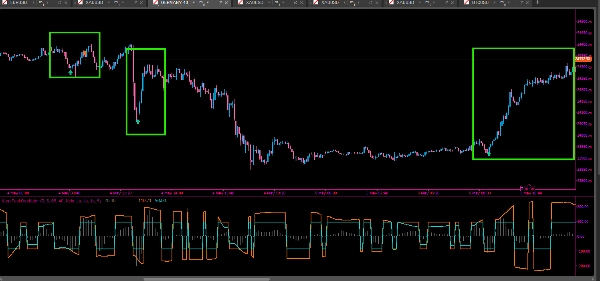
- ピークの疲弊: モメンタムのピークがダイナミックバンドの外側で発生した場合(ミントまたはオレンジの矢印で示される)、現在のトレンドが過剰に伸びており、反転または調整が起こる可能性が高いことを示唆します。
- ダイバージェンスシグナル: KPOは自動的に強気および弱気のダイバージェンスを識別します。ダイバージェンスは価格が新たな極値をつけるがオシレーターがそうしない場合に発生し、モメンタムの弱まりを示します。これらはライトブルー(強気)およびゴールド(弱気)のアイコンで示されます。
- トレンドの確認: ヒストグラムのゼロラインに対する位置を使用してトレンドの方向を確認します。ゼロより上にある場合はロングポジションを支持し、ゼロより下にある場合はショートを支持します。
特徴:
- 統合されたアラートシステム(サウンド、メッセージボックス、視覚アイコン)。
- 異なる資産クラス(外国為替、指数、暗号通貨)に合わせて調整可能な感度。
- 積極的なスキャルピング用の「全ピークモード」または高確率のスイングセットアップ用のフィルターモード。
概要
AI summary
The KasePeakOscillator (KPO) is a technical indicator designed to detect market exhaustion, trend reversals, and momentum shifts by integrating price action with statistical volatility measures. It calculates the relationship between short-term and long-term price cycles adjusted for historical volatility, producing a smooth oscillator around a zero line.
Key components include:
- Histogram (KCD): Represents core momentum; zero-line crossings indicate short-term trend changes.
- Dynamic Bands: Volatility-adjusted thresholds signaling overbought or oversold conditions.
- Automated Peak Detection: Identifies momentum extremes signaling potential trend exhaustion.
The KPO provides automated alerts for peak exhaustion and divergence signals, marking bullish and bearish divergences when price and momentum disagree. Trend direction can be confirmed by the histogram’s position relative to zero.
Features include adjustable sensitivity for various asset classes such as Forex, indices, and cryptocurrencies, an integrated alert system (sound, message, visual icons), and modes tailored for scalping or swing trading. The indicator supports analysis based on price bars and outputs reversal and divergence signals to assist in trading decisions.
Key components include:
- Histogram (KCD): Represents core momentum; zero-line crossings indicate short-term trend changes.
- Dynamic Bands: Volatility-adjusted thresholds signaling overbought or oversold conditions.
- Automated Peak Detection: Identifies momentum extremes signaling potential trend exhaustion.
The KPO provides automated alerts for peak exhaustion and divergence signals, marking bullish and bearish divergences when price and momentum disagree. Trend direction can be confirmed by the histogram’s position relative to zero.
Features include adjustable sensitivity for various asset classes such as Forex, indices, and cryptocurrencies, an integrated alert system (sound, message, visual icons), and modes tailored for scalping or swing trading. The indicator supports analysis based on price bars and outputs reversal and divergence signals to assist in trading decisions.
インジケーターのプロフィール
インジケーターのカテゴリー
モメンタム
出力の種類
シグナル
データ要件
バーのみ
サポート対象のシグナル
反転
ダイバージェンス
カスタマーレビュー
5.0
レビュー: 4
5 | 100 % | |
4 | 0 % | |
3 | 0 % | |
2 | 0 % | |
1 | 0 % |
カスタマーレビュー
September 10, 2026
KasePeakOscillator is a well-presented momentum and exhaustion oscillator with a clear KCD histogram, adaptive-looking bands, configurable short/long cycles and visual peak signals. Testing on EURUSD and XAUUSD across M1, H1 and D1 showed stable rendering and distinct timeframe behavior, with a historical bearish peak marker clearly visible on XAUUSD H1.
August 7, 2026
Your indicator is great but the audio alert is not active. How can I enable it?

July 28, 2026
May 27, 2026
Reliable tool with a learning curve This indicator takes a little time to get used to, but once you understand how to read the signals properly it delivers solid results. Works best when combined with support and resistance levels and a clear market structure.
ディスカッション
よくあるご質問
Key Levels
Volume
cTrader Storeで入手可能な取引ボット、インジケーター、プラグインなどの商品は、第三者の開発者が提供するものであり、情報と技術の取得のみを目的としてご利用いただけます。cTrader Storeはブローカーではなく、投資助言や個人的な推奨を行うことも、将来のパフォーマンスを保証することもありません。




























価格
登録日 21/02/2025
466.3M
取引数量
180.83K
獲得pips
26
販売
7.43K
無料インストール