
说明
## 📊 什么是 Squeeze Momentum Pro?
Squeeze Momentum Pro 是一个专业的波动率和动量指标,基于约翰·卡特(John Carter)推广的著名挤压策略。它识别市场压缩期(挤压),并在爆发性突破发生前进行预测。
该指标结合了两种强大的波动率测量工具:
- **布林带**(20周期,2.0标准差)
- **凯尔特纳通道**(20周期,1.5倍ATR)
当布林带收缩至凯尔特纳通道内时,检测到“挤压”,这表明市场正在积聚能量,准备可能的爆发性走势。
## 🎯 主要特征
### 1. 挤压检测系统
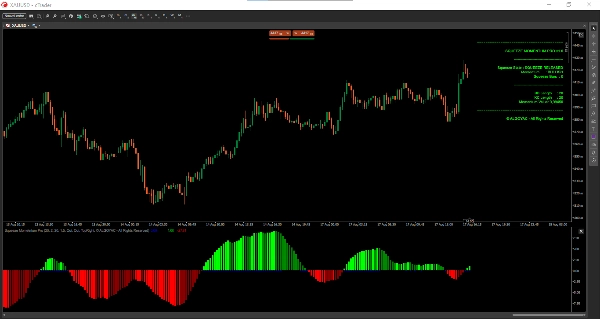
- **黑点** = 挤压激活(市场正在压缩,准备突破)
- **蓝点** = 挤压释放(突破正在发生,观察动量方向)
- **灰点** = 无挤压(正常市场状况)
### 2. 动量直方图
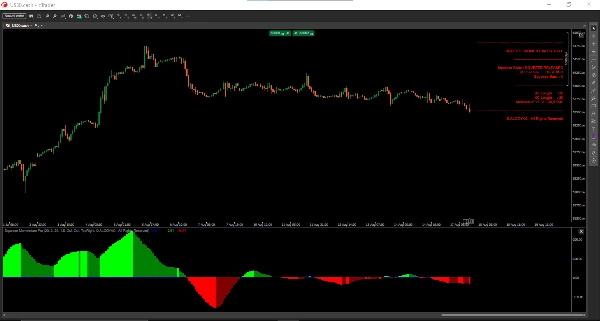
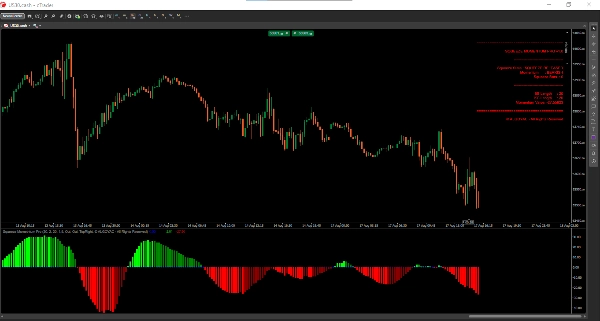
直方图用4种不同颜色显示市场动量:
- **酸橙绿** = 强劲的看涨动量(增加中)
- **深绿** = 弱的看涨动量(减少中)
- **红色** = 强劲的看跌动量(减少中)
- **栗色** = 弱的看跌动量(增加中)
### 3. 实时仪表盘
内置仪表盘显示:
- 当前挤压状态
- 动量方向
- 挤压中的柱数
- 活动参数
## 📈 如何解读信号
### 挤压 + 动量突破
当直方图从红色变为酸橙绿,同时从挤压(黑点)中释放时,这代表强烈的看涨信号。
### 挤压持续时间
较长的挤压期通常导致更强劲的突破。仪表盘显示挤压中的柱数,帮助评估潜在波动性。
### 动量颜色转换
- **红 → 栗色** :卖压减弱,可能反转
- **酸橙 → 绿** :买压减弱,可能反转
- **栗色 → 酸橙** :强烈看涨反转
- **绿 → 红** :强烈看跌反转
## ⚙️ 设置与参数
### 布林带组
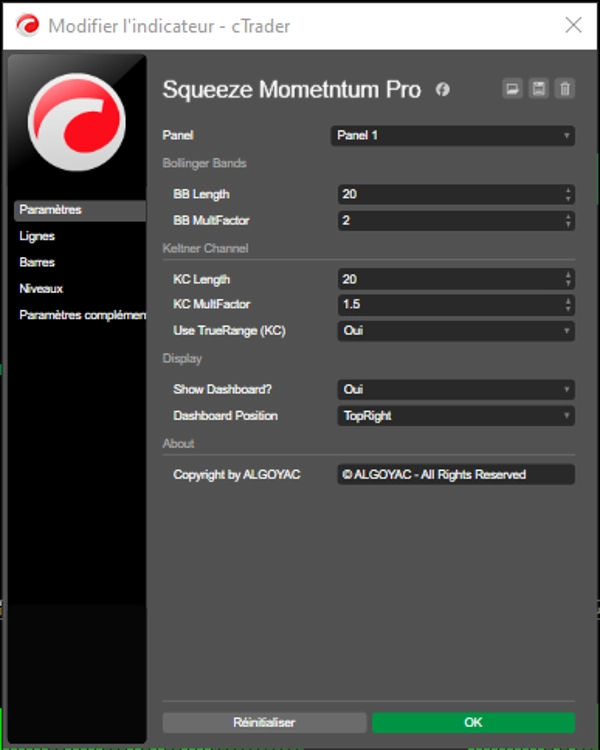
- **BB 长度**(默认:20):布林带计算周期
- **BB 乘数因子**(默认:2.0):标准差乘数
### 凯尔特纳通道组
- **KC 长度**(默认:20):凯尔特纳通道计算周期
- **KC 乘数因子**(默认:1.5):ATR乘数
- **使用真实范围**(默认:true):切换真实范围和高低范围
### 显示组
- **显示仪表盘**(默认:true):显示实时信息面板
- **仪表盘位置**:从4个位置中选择
## 💼 典型使用场景
### 剥头皮交易
- 用于 M1-M5 时间框架
- 挤压释放时结合动量确认入场
- 动量颜色变化时退出
### 日内交易
- 用于 M15-H1 时间框架
- 结合支撑/阻力位使用
- 挤压释放后的首次回调入场
### 波段交易
- 用于 H4-D1 时间框架
- 寻找多柱挤压
- 动量颜色从红转酸橙(或反之)时入场
## 👥 该指标适合谁?
### 适用人群:
- **突破交易者**:识别突破前的动量
- **波动率交易者**:评估市场压缩阶段
- **动量交易者**:跟踪趋势强度和反转
- **初学者到高级用户**:直观界面与专业功能兼备
### 经验水平:
- **初学者**:使用默认设置,借助仪表盘指导
- **中级**:根据特定市场调整参数
- **高级**:结合价格行为和多时间框架使用
## ⚠️ 重要注意事项与限制
1. **假突破**:并非所有挤压都会导致强突破。务必使用额外确认。
2. **市场状况**:在趋势市场中效果最佳。在震荡市场中可能产生假信号。
3. **参数敏感性**:默认设置适用于大多数市场,但特定品种可能需调整。
4. **非独立系统**:最好与其他技术分析工具结合使用以确认信号。
5. **历史表现**:历史信号不保证未来结果。
## 🔧 按市场推荐设置
| 市场 | BB 长度 | KC 长度 | 时间框架 |
|--------|-----------|-----------|-----------|
| 外汇 | 20 | 20 | H1-H4 |
| 股票 | 20 | 20 | D1 |
| 加密货币 | 30 | 30 | H1-H4 |
| 指数 | 25 | 25 | M15-H1 |
## 🚀 入门指南
1. 将指标添加到图表中
2. 初始保持默认设置
3. 观察黑点(挤压形成)
4. 等待挤压释放(蓝点)
5. 通过动量颜色确认(买入为酸橙,卖出为红色)
6. 使用仪表盘快速参考
摘要
Key features include a squeeze detection system with color-coded dots (black for active squeeze, blue for squeeze release, gray for no squeeze), and a momentum histogram displaying four colors to represent bullish and bearish momentum strength and direction. A real-time dashboard provides current squeeze status, momentum direction, squeeze duration, and active parameters.
The indicator supports multiple trading styles and timeframes: scalping (M1-M5), day trading (M15-H1), and swing trading (H4-D1). It is suitable for breakout, volatility, and momentum traders across markets such as Forex, stocks, crypto, and indices, with recommended parameter settings for each.
Users interpret signals by monitoring squeeze states and momentum color transitions to identify potential entries and exits. Adjustable settings allow customization of Bollinger Bands and Keltner Channel parameters, as well as dashboard display options. The indicator is designed for use alongside other technical analysis tools to confirm signals.
客户评价
5 | 50 % | |
4 | 50 % | |
3 | 0 % | |
2 | 0 % | |
1 | 0 % |