
Açıklama
Full Product Summary: Quantum Currency Heatmap Indicator
Overview & Market Data Analysed
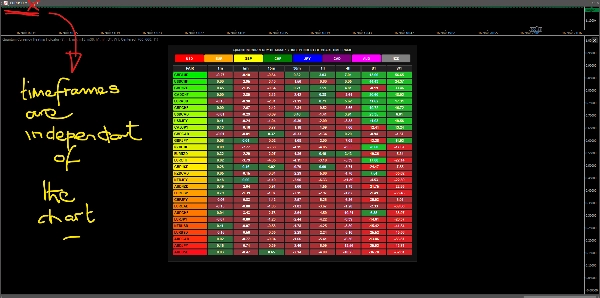
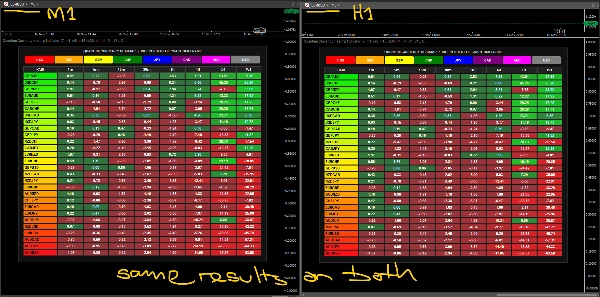
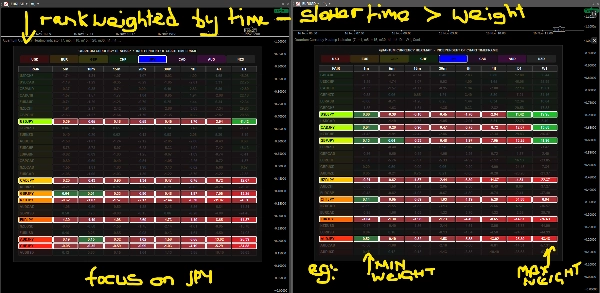
The Quantum Currency Heatmap is a multi-currency, multi-timeframe analytical dashboard that measures rate-of-change momentum across 28 primary and cross currency pairs simultaneously. Operating completely independently of the timeframe selected on the host chart, it displays live momentum readings across 8 customizable timeframe columns while ranking all 28 pairs from strongest to weakest. The ranking weights pairs by timeframe, so a faster timeframe carries less weight than a slower one.
Progressive Timeframe Weighting & Ranking Logic
Rather than treating every interval equally, the ranking ladder applies a progressive weighting model from left to right (from 1 x on Column 1 up to 4 x on Column 8):
- Higher-Timeframe Emphasis: Slower timeframes carry proportionally greater weight in the overall pair ranking than fast intraday intervals, ensuring short-term noise does not override broader structural direction.
- Recommended Column Order: Because weights increase progressively from left to right, users should keep their 8 chosen timeframes ordered from fastest on the left (e.g., 1m) to slowest on the right (e.g., W1) for consistent ranking alignment.
Visual Elements & Interactive Controls
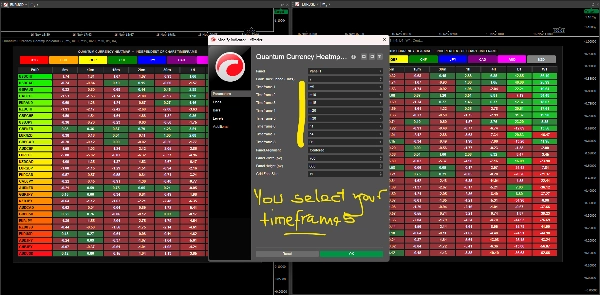
- 8 Customizable Timeframe Columns: Each column can be assigned to any standard cTrader timeframe (defaulting to 1m, 5m, 15m, 30m, 1H, 4H, D1, and W1) with colour-graded positive (green) and negative (red) cells.
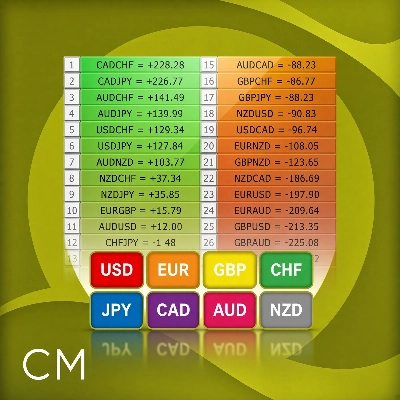
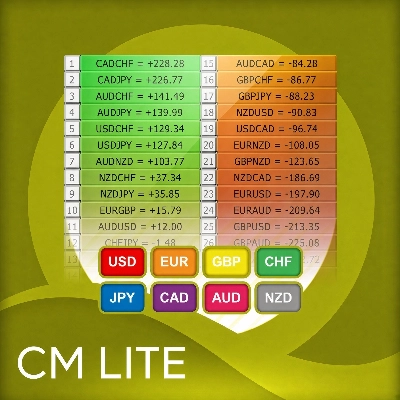
- 28-Pair Weighted Ranking Ladder: Sorts all 28 currency pairs vertically based on their combined weighted score across all 8 columns.
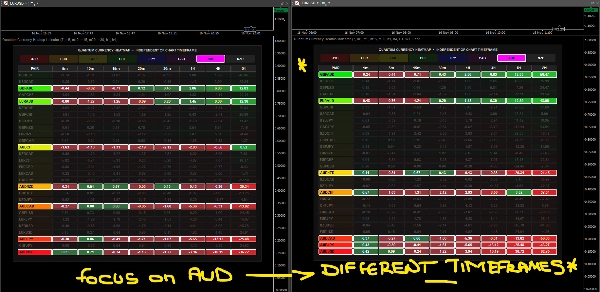
- Interactive Currency Filter Buttons: Eight buttons at the top of the panel (USD, EUR, GBP, CHF, JPY, CAD, AUD, NZD) isolate and highlight every pair containing a selected currency while dimming unrelated rows.
Key Settings & Parameters
- Look Back Period (Bars): Sets the number of historical bars used to calculate rate of change within each timeframe column (Default: 7 bars).
- Timeframe 1 to Timeframe 8: Lets you select each of the 8 chart intervals displayed across the columns.
- Panel Alignment, Width & Height (px): Controls horizontal placement (Centred, Left, Right) and pixel dimensions (760 x 660 default) to fit different monitor resolutions and DPI scaling settings.
- Grid Font Size: Adjusts text size across headers and cells (Default: 11).
Important Limitations & Operational Notes
- Not a Standalone System: This indicator displays historical multi-timeframe rate-of-change calculations and does not generate automated buy or sell signals.
- Methodology Integration Required: This tool must always be used in conjunction with other technical analysis methodologies. Combining multi-timeframe currency heatmap readings with Volume Price Analysis (VPA), key support and resistance levels, and price action is essential to validate market conditions before executing trades.
- Timeframes selected: For scalping trader we suggest the very fast timeframes, while for swing or trend trading use a spread of intermediate to slower timeframes.
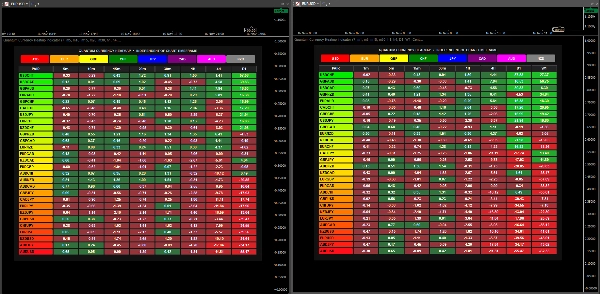
- Multiple displays: Traders can run several displays simultaneously for increased insights or for multiple different strategies
Özet
Key features include customizable timeframe columns (defaulting from 1 minute to 1 week), a weighted ranking ladder that sorts all 28 pairs from strongest to weakest based on combined scores, and interactive currency filter buttons to isolate pairs containing specific currencies. Users can adjust look-back periods for momentum calculation, panel alignment, size, and font settings to fit various display preferences.
The indicator does not generate automated trading signals and should be used alongside other technical analysis methods such as Volume Price Analysis, support/resistance levels, and price action for trade validation. It supports multiple simultaneous displays for diversified strategy insights and is suitable for scalping to swing trading by selecting appropriate timeframes.