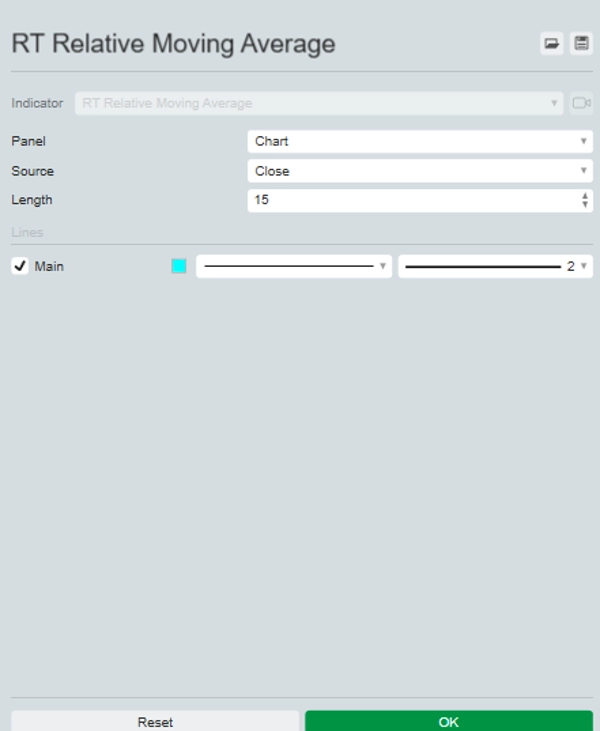
RT Relative Moving Average
Indikator
Versi 1.0, Sep 2024
Windows, Mac
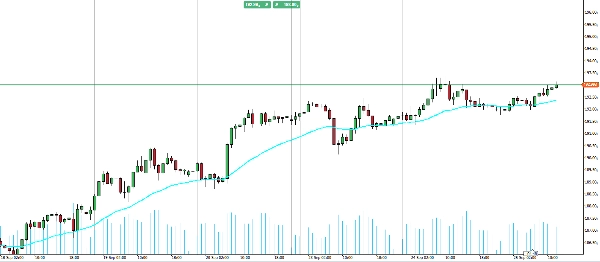
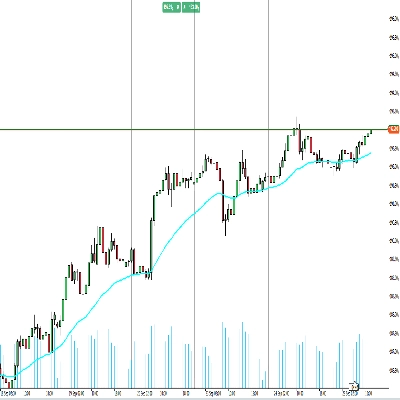
Memperkenalkan Penunjuk Purata Pergerakan Relatif (RMA), kini tersedia untuk cTrader!
Penunjuk ini membawa RMA dari TradingView ke platform dagangan anda. RMA menyediakan purata pergerakan yang lancar dan responsif, membolehkan anda mengenal pasti pergerakan harga dan potensi pembalikan tren dengan lebih baik.
RMA mengurangkan kelewatan sambil mengekalkan ketepatan, menjadikannya tambahan yang sangat berharga untuk alat dagangan anda.
Profil indikator
0.0
Ulasan: 0
Ulasan pelanggan
Belum ada ulasan untuk produk ini. Anda sudah mencuba produk tersebut? Jadilah yang pertama untuk berkongsi pendapat anda!
BTCUSD
Forex
Indices
EURUSD
Commodities
GBPUSD
NZDUSD
Crypto
Stocks
XAUUSD
NAS100
USDJPY
Produk yang tersedia melalui cTrader Store, termasuk bot dagangan, indikator dan plugin, disediakan oleh pembangun pihak ketiga dan diberikan akses untuk tujuan maklumat dan teknikal sahaja. cTrader Store bukan broker dan tidak memberikan nasihat pelaburan, syor peribadi atau sebarang jaminan prestasi masa hadapan.

![Logo "[Stellar Strategies] MARSI Signal Plotter"](https://cdn.ctrader.com/image/webp/7b2b8da6-8f8e-4646-8d4a-4710c516c01e_25567)


Sejak 25/09/2024
20
Jualan