
الوصف
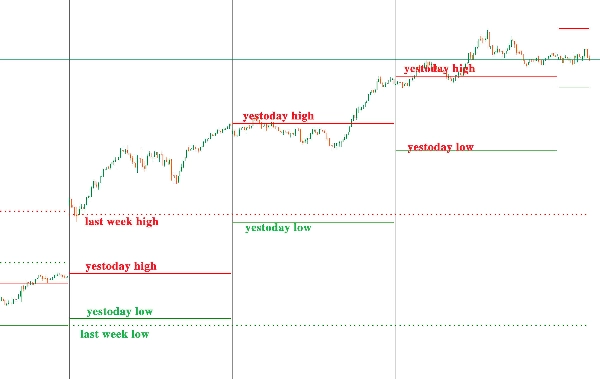
مؤشر "المستويات اليومية" يُستخدم لعرض أعلى/أدنى الأسبوع الماضي وأعلى/أدنى الأمس عبر أطر زمنية مختلفة.
أعلى/أدنى الأسبوع الماضي: معلم بخطوط متقطعة سميكة؛
أعلى/أدنى الأمس: معلم بخطوط صلبة رفيعة.
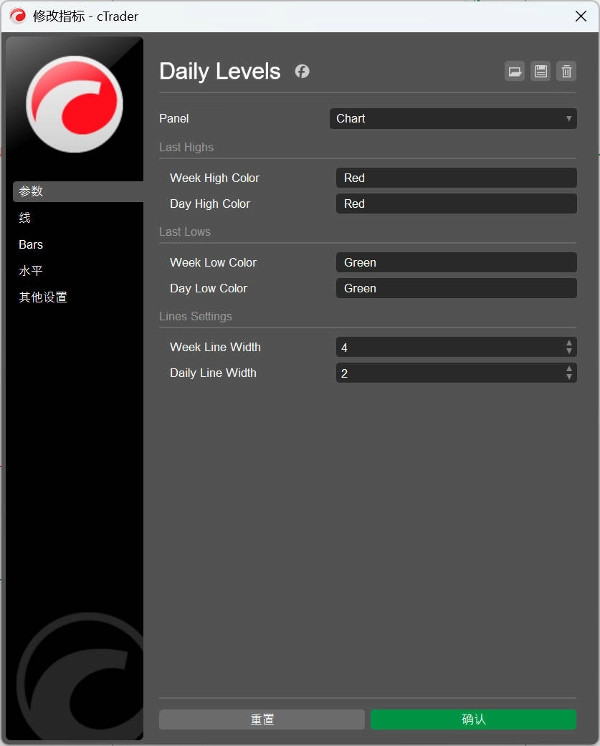
يمكن للمستخدمين تخصيص الألوان وسُمك الخطوط.
“Daily Levels”指标用于在不同的时框框架下显示上周最高价/最低价和昨天最高价/最低价。
上周最高/最低价:使用粗虚线标注;
昨天最高/最低价:使用细实线标注。
用户可以自定义颜色和线条粗细。
الملخص
ملف تعريف المؤشر
تقييمات العملاء
0.0
التقييمات: 0
تقييمات العملاء
لا توجد تقييمات لهذا المنتج حتى الآن. هل جرَّبته بالفعل؟ كن أول من يخبر الآخرين!
مناقشة
الأسئلة الشائعة
Forex
Signal
Breakout
Indices
Commodities
Crypto
يتم توفير المنتجات المتاحة من خلال cTrader Store، بما في ذلك روبوتات التداول والمؤشرات والإضافات، من قبل مطوري الطرف الثالث وإتاحتها لأغراض الوصول المعلوماتي والفني فقط. cTrader Store ليس وسيطًا ولا يقدم نصائح استثمارية أو توصيات شخصية أو أي ضمان للأداء المستقبلي.


![شعار "[CB] Pivot Points Pro"](https://cdn.ctrader.com/image/webp/43463c82-67b0-4f10-a4ba-901bba091d81_32594)


السعر
منذ 30/09/2024
44
المبيعات