
Free Smart Money Concepts (SMC) from TradingView
مؤشر
3.25K التنزيلات
الإصدار 1.0، Oct 2025
Windows, Mac
5.0
التقييمات: 8
الوصف
- 🔷 ما هي مفاهيم المال الذكي (SMC)؟
- SMC هو إطار عمل يعتمد على حركة السعر يركز على كيفية تراكم وتوزيع "المال الذكي" المؤسسي للمراكز.
- يستبدل الأنماط الأساسية بخريطة منطقية لـ هيكل السوق (BOS/CHoCH)، السيولة (EQH/EQL)، كتل الأوامر (OB)، فجوات القيمة العادلة (FVG)، و مناطق العلاوة/الخصم لتوقع الاستمراريات أو الانعكاسات المحتملة.
- 🚀 ما الذي يفعله هذا المؤشر
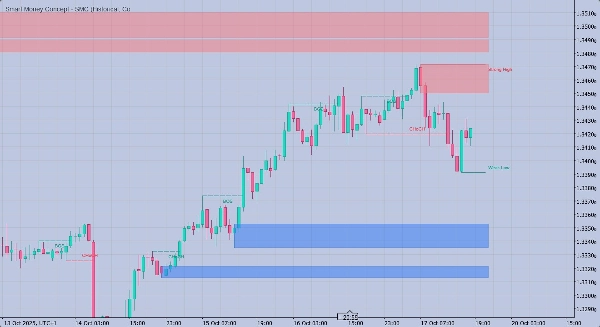
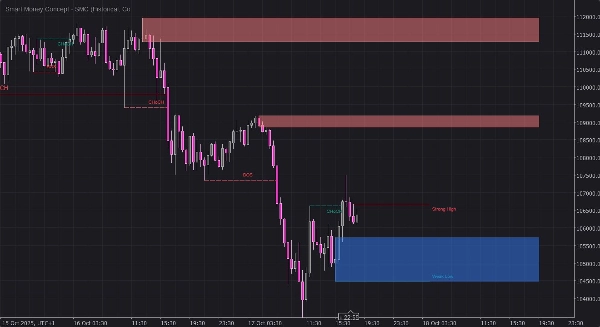
- يكشف عن كسر الهيكل (BOS) و تغيير الشخصية (CHoCH) في كل من الهيكل المتأرجح و الهيكل الداخلي.
- يرسم كتل الأوامر (OB) و فجوات القيمة العادلة (FVG) كمناطق نصف شفافة (ألوان RGBA—الشفافية يتم التحكم بها بالكامل من قبل المستخدم).
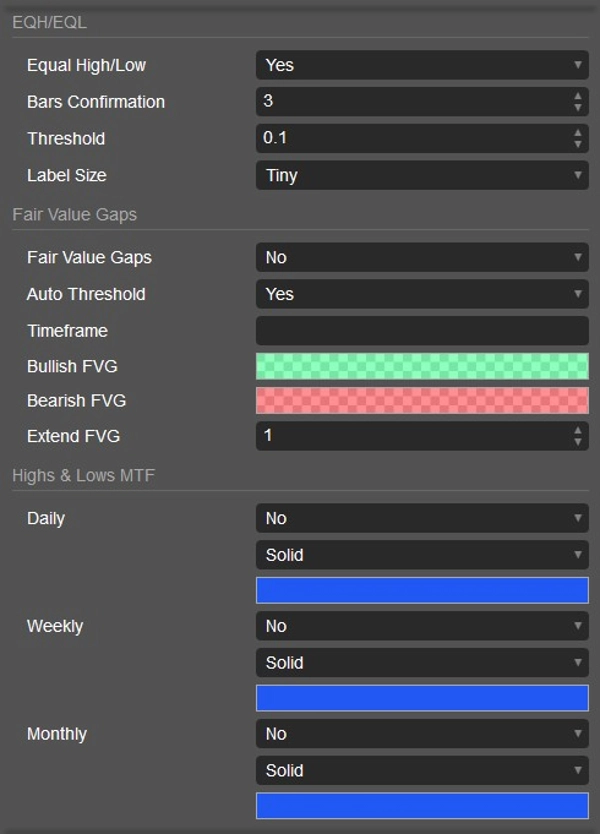
- يحدد الارتفاعات المتساوية/الانخفاضات المتساوية (EQH/EQL) لإظهار تجمعات السيولة.
- يضع علامات الارتفاع/الانخفاض القوي/الضعيف حتى تتمكن من رؤية الجانب الذي من المرجح أن يكون مستهدفًا أو محميًا.
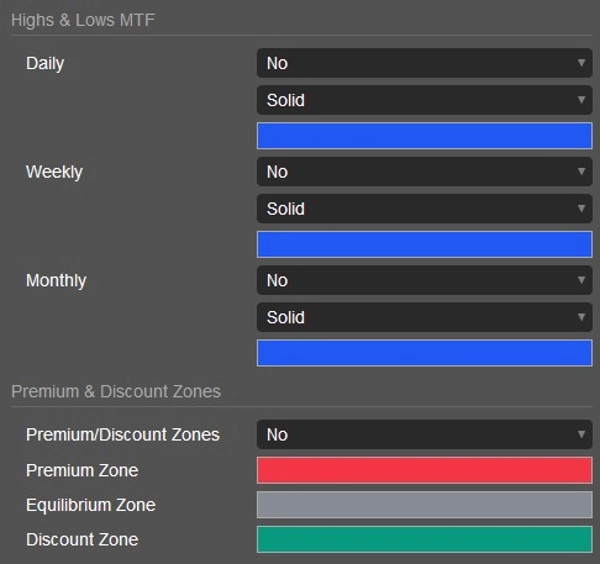
- يرسم مناطق العلاوة/التوازن/الخصم عبر نطاق التأرجح الحالي لسياق منطقة القيمة.
- يغطي الارتفاعات والانخفاضات اليومية/الأسبوعية/الشهرية لتقاطع متعدد الأطر الزمنية.
- يقدم وضعيات الرسم الحالية/التاريخية وأنماط أحادية اللون/ملونة.
- 🧭 كيفية استخدامه (سير العمل العملي)
- 1) اقرأ الهيكل أولاً:
-
- ابحث عن BOS/CHoCH على مستويات التأرجح والداخلية لتحديد التحيز.
- غالبًا ما يشير BOS الصاعد + BOS الداخلي إلى الاستمرار؛ بينما يحذر CHoCH من احتمال الانعكاس.
- 2) ارسم الاختلالات والكتل:
-
- استخدم FVG كـ "أهداف كفاءة" حيث يعيد السعر التوازن غالبًا.
- استخدم OB كمناطق تخفيف محتملة حيث يمكن أن تتشكل نقاط الدخول (مثل الدخول المحدود أو تأكيد الدخول).
- 3) توافق مع السيولة:
-
- راقب EQH/EQL لمسح السيولة؛ المسح + BOS هو سرد قوي لـ SMC.
- لاحظ الارتفاع/الانخفاض القوي/الضعيف لتقييم الجانب الأكثر عرضة للخطر.
- 4) أضف التقاء:
-
- تحقق من العلاوة/الخصم: إعدادات الشراء لها احتمالية أعلى في الخصم؛ إعدادات البيع في العلاوة.
- أضف مستويات MTF (D/W/M) وتوقيت الجلسة الخاص بك للدقة.
- 5) نفذ وأدر:
-
- الدخول: تخفيف OB أو ملء FVG مع توافق الهيكل.
- إيقاف الخسارة: خارج إبطال OB/FVG أو أقرب نقطة محورية قوية حديثة.
- الأهداف: السيولة المقابلة، OB/FVG المعاكس، أو توازن التأرجح.
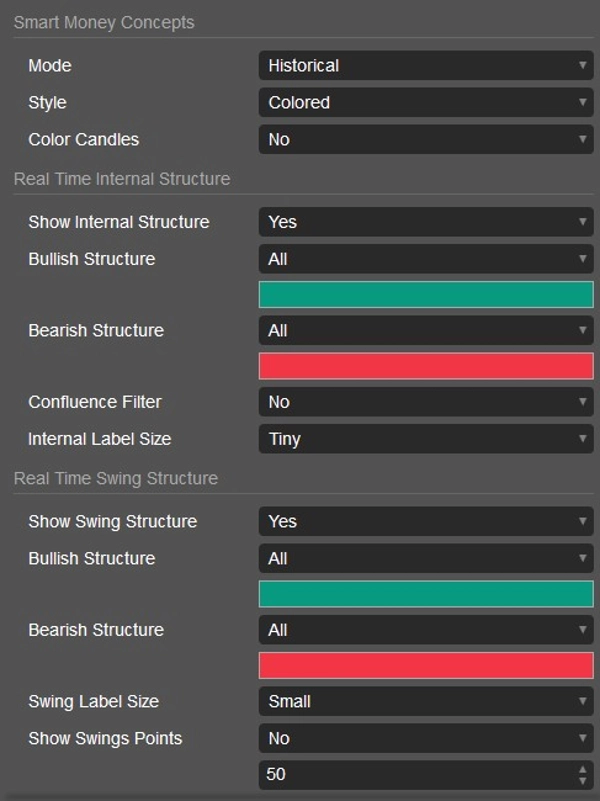
- ⚙️ الإعدادات الرئيسية التي تتحكم بها
- الوضع: التاريخي مقابل الحالي (مظهر نظيف في الوقت الحقيقي).
- مرشحات الهيكل: عرض BOS/CHoCH للتأرجح مقابل الداخلي؛ أحجام العلامات؛ التقاء اختياري (منطق الفتيل).
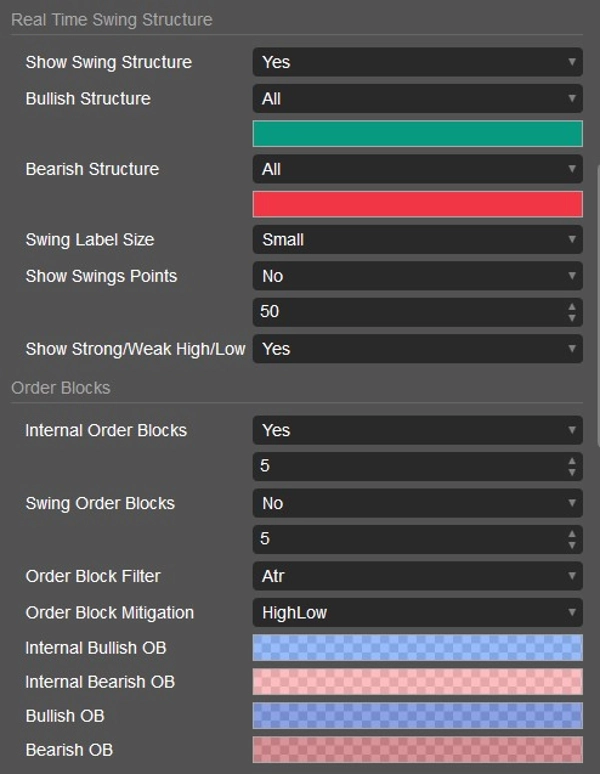
- ألوان OB/FVG: اختر أي لون RGBA؛ قناة ألفا تضبط الشفافية مباشرة.
- الأعداد/الحدود: الحد الأقصى لعدد OB المرئية؛ امتداد FVG؛ حساسية EQH/EQL.
- مستويات MTF: تبديل اليومية/الأسبوعية/الشهرية واختر أنماط الخطوط.
- النمط: ملون أو أحادي اللون، بالإضافة إلى تلوين الشموع اختياري حسب الاتجاه.
- 🧩 لماذا يحب المتداولون هذا
- منطق التكافؤ 1:1 مع نهج SMC الشهير في TradingView (تكافؤ BOS/CHoCH، OB/FVG).
- مرئيات نظيفة: تبقى المناطق والعلامات قابلة للقراءة وتتحدث بسلاسة في الوقت الحقيقي.
- مرن: يعمل من السكالبينج إلى التداول المتأرجح، على أي رمز أو إطار زمني يدعمه cTrader.
- ✅ أفضل الممارسات
- اجمع سياق SMC مع إدارة المخاطر ودليل واضح (قواعد الدخول، الإيقاف، الهدف).
- استخدم التنبيهات أو قوائم المراقبة حول مستويات HTF وافتتاح الجلسات لتحركات ذات جودة أعلى.
- تحقق دائمًا مع جلسة السوق و تقويم الأخبار لتجنب التقلبات العشوائية.
- 📌 ملاحظات
- تعتمد المرئيات على بيانات الوسيط (تغذيات العطاء/الجلسات يمكن أن تختلف).
- هذه الأداة ليست نصيحة مالية؛ التداول ينطوي على مخاطر. استخدمها على حساب تجريبي قبل التداول الحقيقي.
الملخص
ملخص الذكاء الاصطناعي
Free Smart Money Concepts (SMC) indicator for cTrader replicates the TradingView SMC framework, focusing on institutional price action analysis. It identifies key market structure elements such as Break of Structure (BOS) and Change of Character (CHoCH) on both swing and internal levels to help establish trading bias. The indicator visually marks Order Blocks (OB) and Fair Value Gaps (FVG) as semi-transparent zones, highlighting potential entry and mitigation areas. It also detects Equal Highs/Lows (EQH/EQL) to indicate liquidity pools, and labels strong or weak highs and lows to assess market vulnerability.
Additional features include plotting premium, equilibrium, and discount zones within the current swing range for value-area context, and overlaying daily, weekly, and monthly highs and lows for multi-timeframe confluence. Users can customize drawing modes (present or historical), color schemes (monochrome or colored), and opacity levels for OB/FVG zones. The indicator supports flexible use across all symbols and timeframes available in cTrader, suitable for scalping to swing trading.
The workflow involves reading market structure, mapping imbalances and blocks, aligning with liquidity, adding confluence from premium/discount zones and multi-timeframe levels, and executing trades with defined entry, stop, and target rules. Visuals depend on broker data feeds. This tool is intended for analysis and does not provide financial advice.
ملف تعريف المؤشر
تقييمات العملاء
5.0
التقييمات: 8
5 | 100 % | |
4 | 0 % | |
3 | 0 % | |
2 | 0 % | |
1 | 0 % |
تقييمات العملاء
July 6, 2026
May 23, 2026
March 4, 2026
December 11, 2025
November 4, 2025
Superfantastic 3 in one zones, one of the best indicators on here ,and for free. If you cant figure it out after this, you got something wrong with ya :). Nicely done my friend, how did you code it C# or python?
مناقشة
الأسئلة الشائعة
BTCUSD
Forex
Signal
Breakout
Indices
EURUSD
Commodities
GBPUSD
NZDUSD
Fibonacci
Prop
ZigZag
Scalping
Fair Value Gap
SMC
Crypto
Stocks
XAUUSD
NAS100
ATR
USDJPY
يتم توفير المنتجات المتاحة من خلال cTrader Store، بما في ذلك روبوتات التداول والمؤشرات والإضافات، من قبل مطوري الطرف الثالث وإتاحتها لأغراض الوصول المعلوماتي والفني فقط. cTrader Store ليس وسيطًا ولا يقدم نصائح استثمارية أو توصيات شخصية أو أي ضمان للأداء المستقبلي.


السعر
46
المبيعات
3.96K
التثبيتات المجانية