
Compare Symbol
مؤشر
200 التنزيلات
الإصدار 1.0، May 2025
Windows, Mac
الوصف
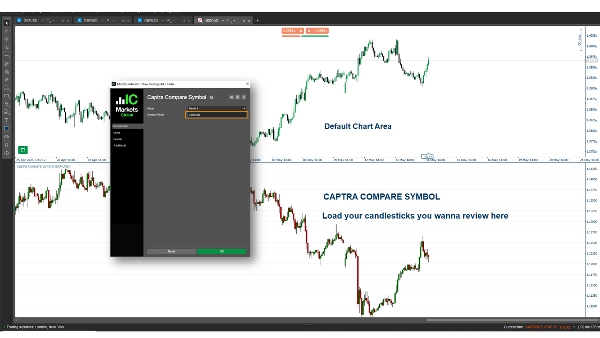
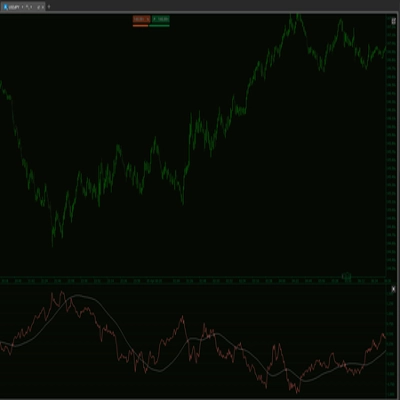
Captra Compare Symbol هو مؤشر cTrader يعرض سعر الإغلاق ويرسم الشموع اليابانية (الفتيل، الجسم) لرمز محدد، مثل EURUSD، على الرسم البياني. يدعم أطر زمنية مختلفة (مثل 5 دقائق، 15 دقيقة، ساعة واحدة، يومي) مع مرئيات قابلة للتخصيص، باستخدام أسعار الافتتاح/الإغلاق/الأعلى/الأدنى لتمثيل دقيق.
الملخص
ملخص الذكاء الاصطناعي
Captra Compare Symbol is a cTrader indicator that visualizes price data of a selected trading symbol, such as EURUSD, directly on the chart. It plots the close price and renders candlesticks—including wicks and bodies—using open, high, low, and close prices for precise representation. The indicator supports multiple timeframes, including 5-minute, 15-minute, 1-hour, and daily intervals. Visual elements are customizable to fit user preferences. This tool enables traders to compare the price action of an additional symbol alongside their primary chart, facilitating multi-symbol analysis within the cTrader platform.
ملف تعريف المؤشر
تقييمات العملاء
0.0
التقييمات: 0
تقييمات العملاء
لا توجد تقييمات لهذا المنتج حتى الآن. هل جرَّبته بالفعل؟ كن أول من يخبر الآخرين!
مناقشة
الأسئلة الشائعة
EURUSD
يتم توفير المنتجات المتاحة من خلال cTrader Store، بما في ذلك روبوتات التداول والمؤشرات والإضافات، من قبل مطوري الطرف الثالث وإتاحتها لأغراض الوصول المعلوماتي والفني فقط. cTrader Store ليس وسيطًا ولا يقدم نصائح استثمارية أو توصيات شخصية أو أي ضمان للأداء المستقبلي.
المزيد من هذا المؤلف


السعر
86.67M
حجم التداول
1.99M
الربح بالبيب
3.67K
التثبيتات المجانية