
Bar Explosion
مؤشر
204 التنزيلات
الإصدار 1.0، May 2025
Windows, Mac
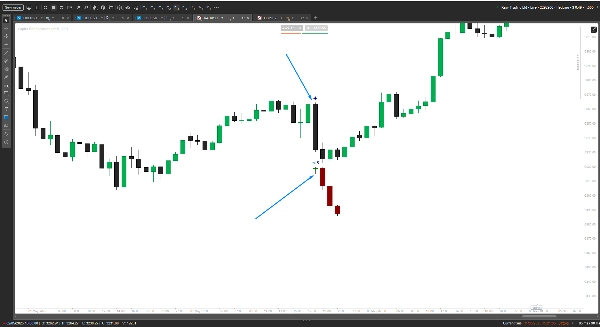
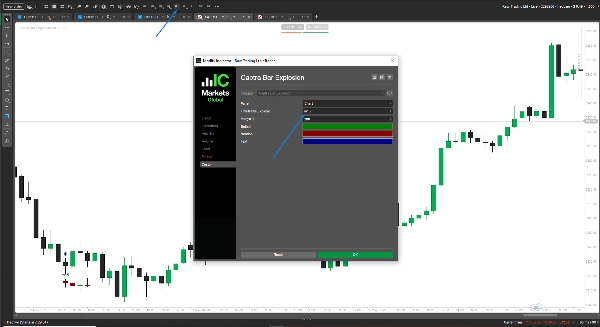
أطلق العنان لقوة انفجار أشرطة كابترا، مؤشر cTrader من الدرجة الأولى مصمم للسيطرة على لعبتك في التداول. هذا الوحش يعرض مخططات الشموع المصغرة المتفجرة، مما يتيح لك اكتشاف الاتجاهات بدقة متناهية. قم بتخصيص الإطار الزمني (مثل Minute15)، والألوان (صعودي/أخضر، هبوطي/أحمر داكن)، والهوامش (افتراضي 30 نقطة) لتناسب أسلوبك. مثالي للمتداولين السريعين والمتأرجحين، وهو مبني لـ cTrader بأداء سلس.
يرجى ترك تقييم لإعلامنا إذا كان مفيدًا.
ملف تعريف المؤشر
0.0
التقييمات: 0
تقييمات العملاء
لا توجد تقييمات لهذا المنتج حتى الآن. هل جرَّبته بالفعل؟ كن أول من يخبر الآخرين!
يتم توفير المنتجات المتاحة من خلال cTrader Store، بما في ذلك روبوتات التداول والمؤشرات والإضافات، من قبل مطوري الطرف الثالث وإتاحتها لأغراض الوصول المعلوماتي والفني فقط. cTrader Store ليس وسيطًا ولا يقدم نصائح استثمارية أو توصيات شخصية أو أي ضمان للأداء المستقبلي.
المزيد من هذا المؤلف


قد يعجبك أيضًا


86.08M
حجم التداول
1.91M
الربح بالبيب
3.56K
التثبيتات المجانية