
คำอธิบาย
แนวคิดของ "วิศวกรรมย้อนกลับ"
นวัตกรรมหลักของตัวบ่งชี้นี้อยู่ที่ อัลกอริทึมวิศวกรรมย้อนกลับ โดยปกติ สโตกาสติกออสซิลเลเตอร์จะนำข้อมูลราคาและแปลงเป็นตัวเลขระหว่าง 0 ถึง 100 ตัวบ่งชี้นี้ทำในทางกลับกัน: มันนำระดับทางคณิตศาสตร์ของออสซิลเลเตอร์และ ฉายซ้ำกลับไปยังมาตราส่วนราคา.
สิ่งนี้ช่วยให้เทรดเดอร์แปลงโมเมนตัมทางคณิตศาสตร์เป็น ระดับราคาที่ชัดเจน (ดอลลาร์หรือพิปส์) ได้โดยตรงบนแผนภูมิ
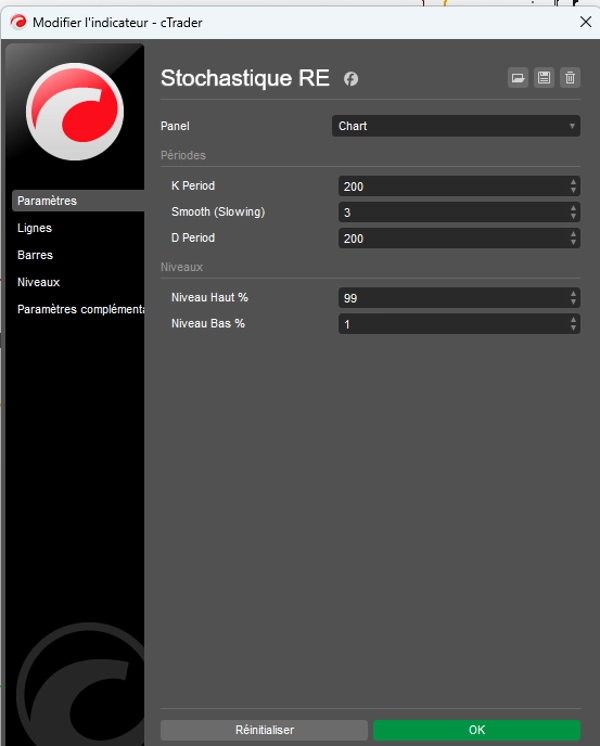
การกำหนดขอบเขต: เพดาน (99%) และพื้น (1%)
แตกต่างจากการตั้งค่าคลาสสิก (80/20) ตัวบ่งชี้นี้ตั้งค่าเริ่มต้นเป็น 1% และ 99% การกำหนดค่านี้มีวัตถุประสงค์เฉพาะ: มันกำหนดขีดจำกัดทางกายภาพของราคา
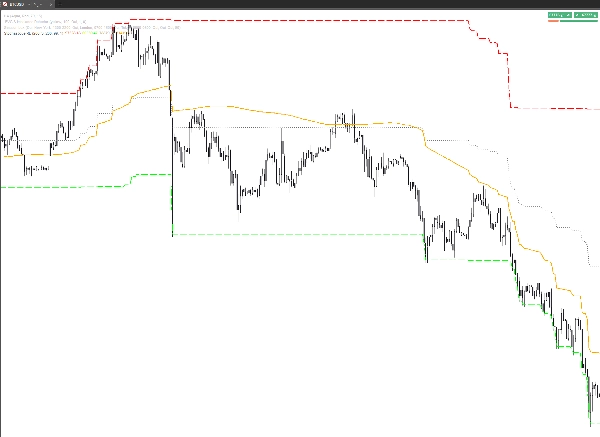
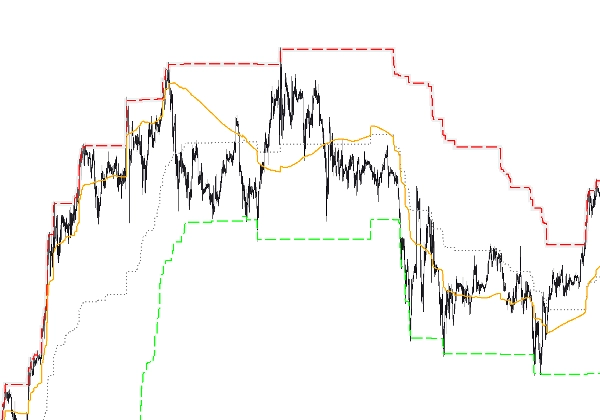
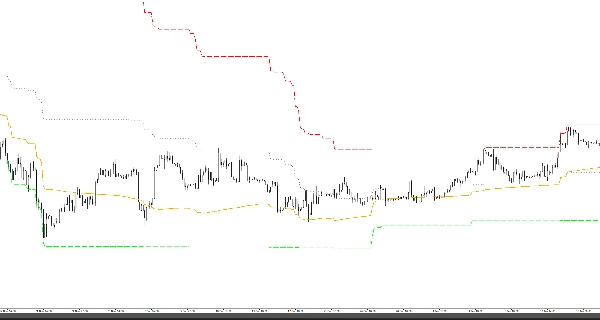
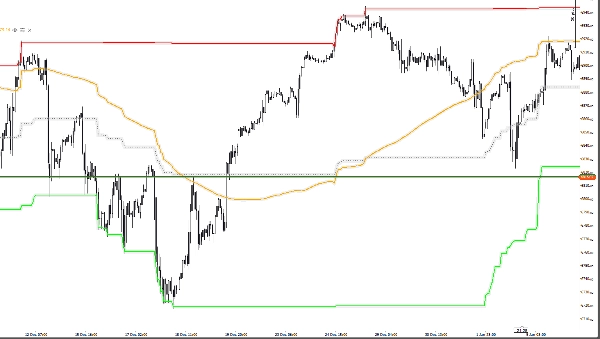
- ระดับ 99% (เพดานราคา): มันกำหนดราคาสูงสุดที่ตลาดสามารถไปถึงก่อนที่จะถือว่าหมดแรงเคลื่อนไหว 99% ของช่วงเวลาที่กำหนด มันคือ "เส้นแบ่ง" ของราคา
- ระดับ 1% (พื้นราคา): มันกำหนดราคาต่ำสุด ซึ่งเป็นแนวรับสุดท้ายของรอบปัจจุบัน เป็นระดับที่ราคาหมดแรงเคลื่อนไหวลง 99% เมื่อเทียบกับประวัติศาสตร์ล่าสุด
ทำไมมันถึง "กำหนดราคา"?
ด้วยระบบนี้ เส้นสัญญาณสีส้ม %D ไม่ใช่แค่เส้นโค้งที่เคลื่อนที่ในสุญญากาศอีกต่อไป
- การระบุตำแหน่งราคา: แสดงตำแหน่งที่แน่นอนของ "ราคายุติธรรม" ที่ถ่วงน้ำหนักด้วยโมเมนตัมของมัน
- การทำแผนที่ช่วงราคา: มันเปลี่ยนแผนภูมิให้เป็นแผนที่ที่คุณสามารถเห็นได้ว่าราคาปัจจุบัน "คุ้มค่า" กับ 1% หรือ 99% ของศักยภาพของมันหรือไม่
- เป้าหมายที่ชัดเจน: ถ้าเส้นสีส้มเคลื่อนขึ้น มันไม่ได้แค่พยายามไปถึง "80" แต่มันพยายามไปถึง ราคาที่แม่นยำ ที่แสดงโดยเส้นสีแดง (99%)
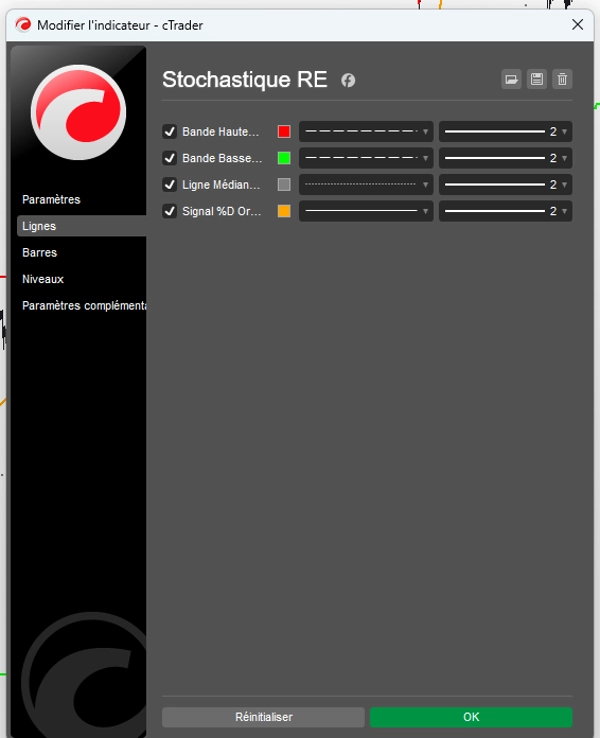
ฟังก์ชันของเส้น (แท็บเส้น)
ทุกอย่างสามารถปรับแต่งได้เพื่อการอ่านภาพทันที:
- แถบบน (99%): เพดานราคาทางทฤษฎี
- แถบล่าง (1%): พื้นราคาทางทฤษฎี
- เส้นกลาง (50%): จุดหมุนกลาง โซนสมดุล
- สัญญาณสีส้ม %D: เคอร์เซอร์แบบไดนามิกที่เคลื่อนที่ระหว่างพื้นและเพดานเพื่อกำหนดทิศทางตลาด
สรุปสำหรับเทรดเดอร์
ตัวบ่งชี้นี้ไม่ได้แค่บอกว่าตลาด "ซื้อมากเกินไป"; มันแสดงให้คุณเห็น ที่ราคาใดอย่างแม่นยำ ที่ตลาดกลายเป็นแพงเกินจริงทางกายภาพ (99%) หรือถูกเกินไป (1%) มันเป็นเครื่องมือที่แม่นยำซึ่งนำคณิตศาสตร์กลับสู่ความเป็นจริงของสมุดคำสั่ง
สรุป
The indicator displays these boundaries directly on the price chart, allowing traders to see exact price levels where the market is considered overbought or oversold. Key features include customizable lines for the upper band (99%), lower band (1%), mid line (50%), and an orange signal %D line that dynamically indicates market direction between these boundaries.
By translating momentum into precise price targets, Stochastique RE helps traders localize fair price zones, map price ranges, and identify concrete price targets rather than abstract oscillator values. It supports various markets including Forex, stocks, commodities, indices, and cryptocurrencies, with symbol tags such as BTCUSD, EURUSD, GBPUSD, XAUUSD, NAS100, and USDJPY.
รีวิวจากลูกค้า
5 | 67 % | |
4 | 33 % | |
3 | 0 % | |
2 | 0 % | |
1 | 0 % |


