present
Зарегистрируйтесь и получите скидку $50 на первую покупку
Trading product for Correlation Meter Индикатор Premium/Discount  RSI, image 1
Correlation Meter
Индикатор
Версия 1.0, Apr 2026
Windows, Mac
Trading product for Correlation Meter Индикатор Premium/Discount  RSI, image 2
Trading product for Correlation Meter Индикатор Premium/Discount  RSI, image 3
12.28M
Торгуемый объем
31.27K
Выигранные пипы

Описание

Track correlation divergences before the market corrects.

Most traders know that XAUUSD and DXY move inversely. Or that XAUUSD and XAGUSD tend to move together. What they don't have is a tool that tells them when that relationship breaks down and what to do about it.

Correlation Meter calculates a live Pearson correlation coefficient between any two symbols using log-returns (the statistically correct input for financial data). It then compares that short-term reading against a longer historical average and fires an alert the moment the gap becomes significant.

How it works

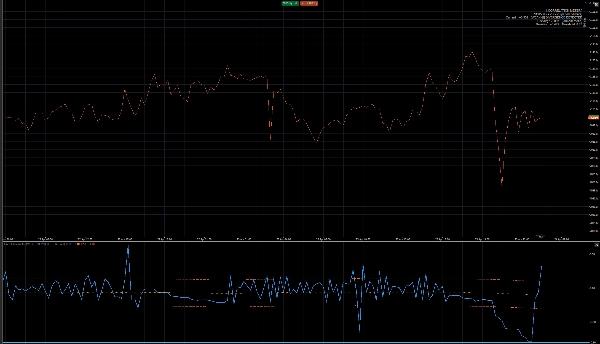
The indicator opens in a sub-window below your chart, similar to RSI. A blue line shows the current 50-bar correlation. An orange dotted line shows the 200-bar historical average. Two red bands mark the divergence threshold. When the blue line breaks outside those bands, the correlation between your two symbols has shifted beyond its normal range meaning one symbol has lagged behind the other and a statistical reversion is probable.

A colour-coded overlay panel in the corner of your chart shows correlation strength at a glance: from Very Strong (≥0.90) down to None (<0.30).

Risk warning

If you hold two highly correlated positions open at the same time. For example XAUUSD long and XAGUSD long with a +0.93 correlation the indicator flags a red warning that your actual risk exposure is nearly double what it appears. Two positions are not two separate bets if they move as one asset.

Pre-configured pairs

Works with any two symbols your broker offers. Suggested starting pairs: XAUUSD/DXY, XAUUSD/XAGUSD, USOIL/USDCAD, EURUSD/DXY, SPX500/VIX.

Parameters

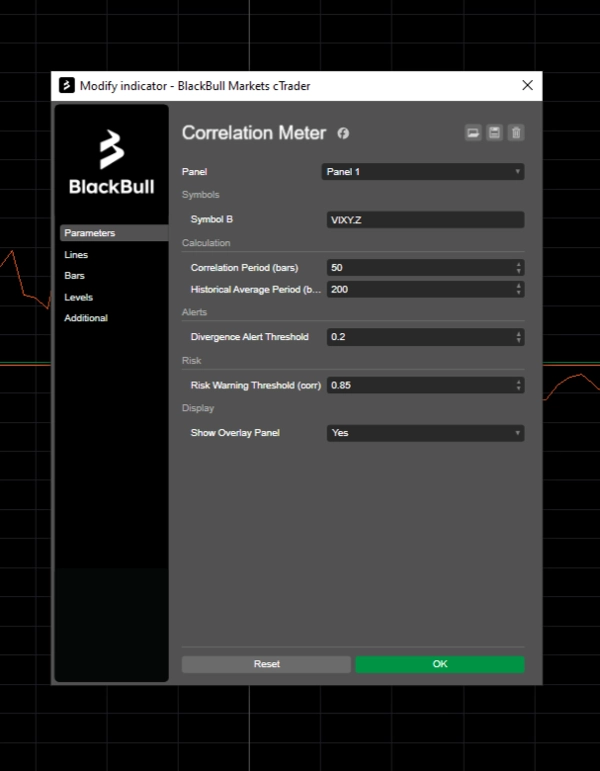
All key settings are adjustable: correlation period, historical average period, divergence threshold, and risk warning sensitivity. No coding required.

Сводка

Профиль индикатора
Категория индикатора
Статистика
Тип вывода
Сигналы
Требования к данным
Только бары
Поддерживаемые сигналы
Расхождение
Сила тренда

Обсуждение

Отзывы покупателей

0.0
Отзывы: 0
Отзывы покупателей
У этого продукта еще нет отзывов. Уже попробовали его? Поделитесь впечатлениями!

Частые вопросы

Premium/Discount
RSI
Imbalance
Market Structure
Продукты, доступные в cTrader Store, включая торговых ботов, индикаторы и плагины, предоставляются сторонними разработчиками и доступны исключительно в информационных и технических целях. cTrader Store не является брокером и не предоставляет инвестиционные консультации, персональные рекомендации или какие-либо гарантии будущей доходности.

Больше от этого автора

Индикатор
Prop
Forex
+11
Detects revenge trades in real time and shows exactly how much they've cost you, before the next one makes it worse.

Вам также может понравиться

Индикатор
VWAP
Support & Resistance
Trading.FC$_vwap Algo shows VWAP trends, dynamic support/resistance and deviation bands to spot potential trade entries.
Индикатор
📊 Smart Floating Risk Pro – Advanced Risk Management for cTrader
Индикатор
Prop
Forex
+11
🧭 See when your market tends to move—by Month, Day-of-Week, or Hour-of-Day🧭
Индикатор
Prop
Forex
+12
Identify and trade breakouts with Consolidation Zones! Visualize price consolidation areas for trading opportunities.
Индикатор
ATR
EMA
+5
Candle timer with live profit tracking on chart – displays pips, currency value, and percentage in real time.
Индикатор
Prop
Forex
+4
HMA MTF 2.0 (Multi-Timeframe )
Логотип продукта "MARainbow"
Высокий рейтинг
4.2
(4)
$19
/
$38
Индикатор
Forex
Crypto
+3
MARainbow gives you the edge with four customizable moving averages—each color-coded for instant recognition.
Логотип продукта "CHOCH BREAKOUT BLOCK"
Высокий рейтинг
5.0
(5)
$19
/
$30
Индикатор
SMC
BTCUSD
+9
Detects CHoCH breakouts, draws interest zones & auto Fibo. Built for Smart Money & Price Action Engulfing confirmation
Индикатор
BOS
EMA
+5
VWAP Bands indicator with 3 standard deviation levels, buy/sell zones, and a draggable ON/OFF button to toggle the entir
Индикатор
Shows BUY & SELL signals for 3 & 4 BAR PATTERN (Morning star/ Evening star). It is adjustable and it will SHOW ARROWS.
Логотип продукта "AutoLines™ Support & Resistance"
Высокий рейтинг
4.6
(5)
$19
/
$20
Индикатор
Breakout
FlexSR auto‑detects pivot highs/lows to plot dynamic support & resistance lines Features customizable styling and option
Индикатор
AI
SMC
+17
Smart Support/Resistance lines auto calculated from D1/H4/H1/M15. Highly customizable visuals + built in Backtest Mode.
Логотип продукта "Market Structure Shift"
Высокий рейтинг
4.2
(4)
$19
/
$35
Индикатор
Prop
Forex
+11
Market Structure Shift – Professional Market Structure Oscillator
Логотип продукта "Boris Indicator"
Высокий рейтинг
4.6
(5)
$19
/
$28
Индикатор
AI
Grid
+17
BORIS Easy Trend: Relax & scalp with 6-TF alignment. Clear BUY/SELL signals & movable UI/HUD make trading effortless.
Индикатор
SMC
Prop
+4
📈 Trading Sessions Indicator — London, New York & Tokyo Visualize Key Market Sessions + High/Low Levels with Precision
Индикатор
Doji
Volume
+5
Instantly spot high-liquidity institutional moves with clean, non-obtrusive triangle alerts on cTrader charts.
Логотип продукта "SMC Liquidity Hunter"
Высокий рейтинг
4.0
(4)
$19
/
$29
Индикатор
ATR
BOS
+4
Based on market structure and draws liquidity zones, institutional flows, and consolidation ranges. Smart Money Concepts
Логотип продукта "Dot Momentum %BB Indicator"
Высокий рейтинг
4.2
(4)
$19
Индикатор
RSI
Signal
+2
Dynamic circles visualize price's volatility position. Like RSI for market overextension & stretch. Quantify context.

Цена

12.28M
Торгуемый объем
31.27K
Выигранные пипы