


الوصف
ما يفعله
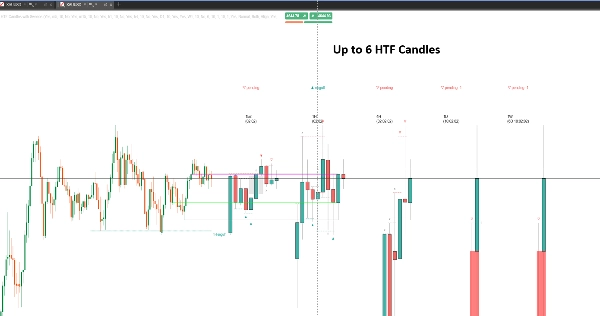
يرسم HTF Candles with Sweeps ما يصل إلى ستة أطر زمنية أعلى كشموع حقيقية بجانب الرسم البياني الخاص بك — 5 دقائق، 15 دقيقة، ساعة واحدة، 4 ساعات، يومي، أسبوعي، أو أي دقة تختارها — بحيث تكون قصة الإطار الزمني الأعلى بجانب السعر الذي تتداول عليه بدلاً من أن تكون على بعد تبديل رسم بياني واحد.
فوق تلك الشموع، يكتشف عمليات مسح السيولة: شمعة تتداول عبر أعلى أو أدنى خلفها لأخذ الأوامر المستقرة هناك. تتوقف معظم الأدوات عند الإشارة إلى الطعنة. هذا يتابع ما يحدث بعد ذلك، لأن المسح الذي يتم استرداده والمسح الذي يتحول إلى اختراق يعنيان أشياء متعاكسة.
لوحة الإطار الزمني الأعلى
ستة فتحات مستقلة، كل منها بإطار زمني خاص به، وعدد الشموع والألوان. كل مجموعة ترسم بأجسام وفتائل صحيحة، وعد تنازلي مباشر للإغلاق التالي، وتسميات الإطار الزمني أعلاه وأسفله.
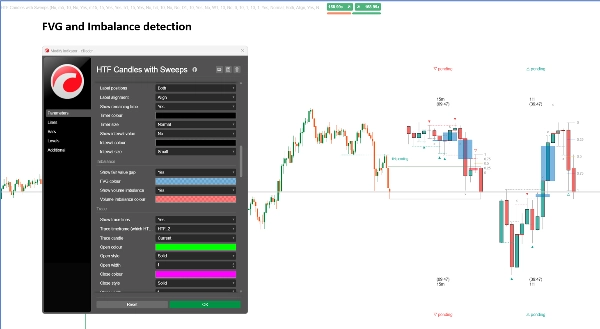
بين الشموع المرسومة، تشير اللوحة أيضًا إلى فجوات القيمة العادلة و اختلالات الحجم — نفس الاختلالات التي ستقرأها على الرسم البياني للإطار الزمني الأعلى نفسه، دون فتحه.
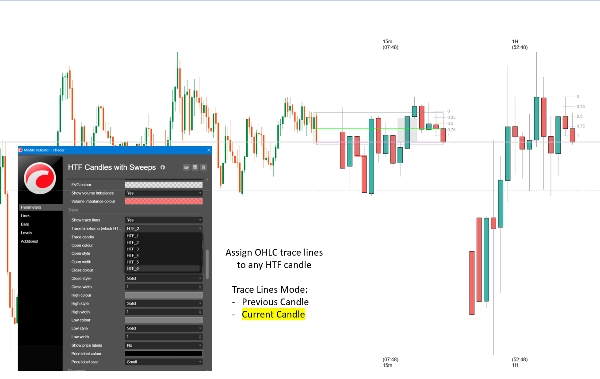
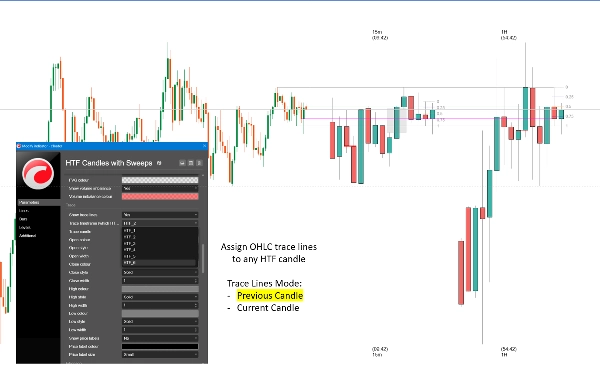
خطوط التتبع تربط فتح، أعلى، أدنى وإغلاق الإطار الزمني المختار بالشمعة الدقيقة على الرسم البياني الخاص بك حيث تم طباعتها، حتى تتمكن من رؤية مصدر المستوى. اختر الشمعة التي لا تزال تتشكل أو الأخيرة المكتملة.
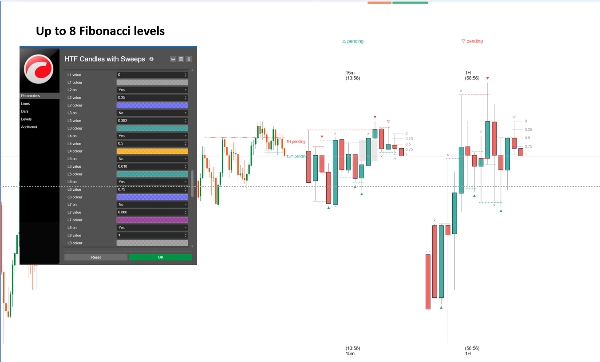
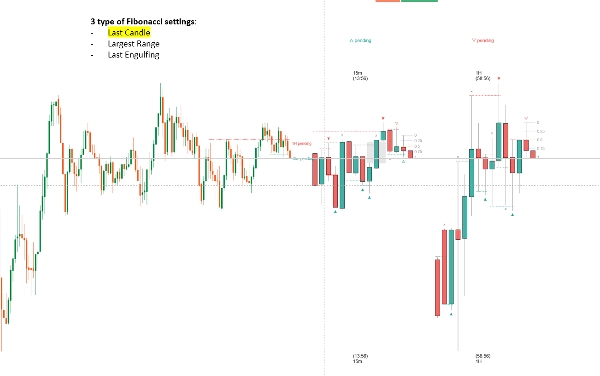
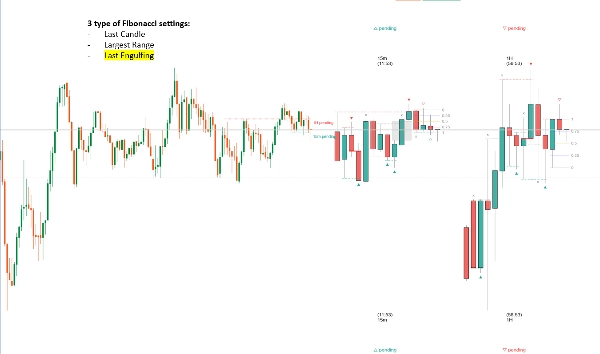
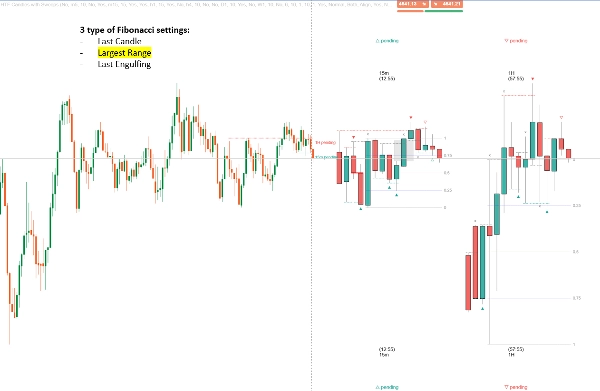
مستويات فيبوناتشي تُسقط من شمعة إطار زمني أعلى مع ثمانية مستويات قابلة للتكوين ومرساة ذكية تختار الشمعة لك: الشمعة الأخيرة المكتملة، أوسع شمعة من الأعلى إلى الأدنى في العرض، أو أحدث شمعة ابتلاعية.
كشف مسح السيولة
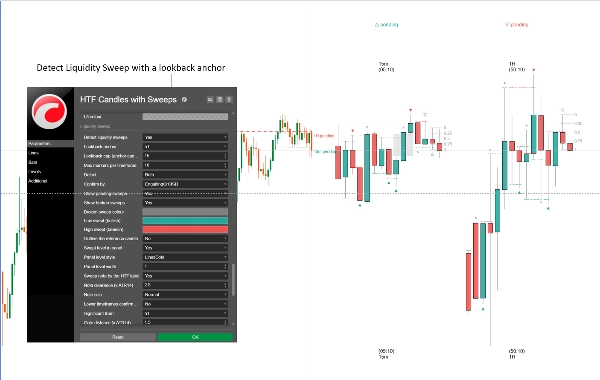
لكل شمعة إطار زمني أعلى مكتملة، يمشي المحرك إلى الوراء ويجد أعلى قمة — أو أدنى قاع — التي تجاوزتها الشمعة فعليًا، متوقفًا عند أول شمعة لم يستطع تجاوزها. هذا المستوى هو ما أخذه المسح.
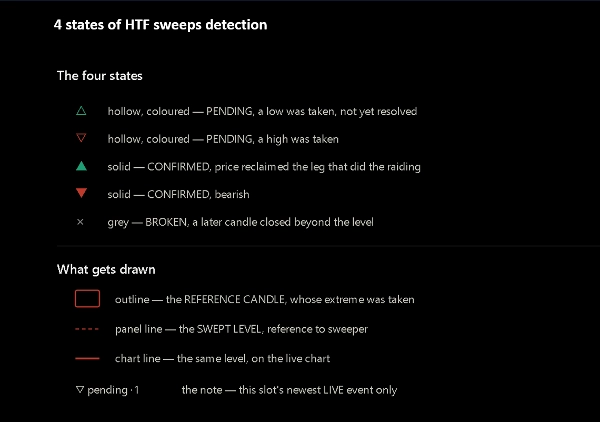
ثم يتبع المسح خلال أربع حالات:
— قيد الانتظار — تم أخذ المستوى، ولم يتم حله بعد
— تم التأكيد بواسطة CISD — أغلق السعر مرة أخرى عبر فتح الحركة التي أنتجت الحد الأقصى
— تم التأكيد بواسطة الابتلاع — ابتلع جسم شمعة لاحقة الشمعة التي قامت بالمسح وأغلق ضدها
— مكسور — أغلقت شمعة لاحقة فوق المستوى، لذا كان اختراقًا، وليس مسحًا
كل حالة تحمل علامتها الخاصة، لذا تظهر الشمعة التي قامت بالمسح دائمًا ذلك، وتخبرك العلامة كيف انتهى الأمر. لا يعيد الرسم: يتم الحكم فقط على الشموع المكتملة، ويتم اتخاذ كل تغيير حالة عند الإغلاق.
تلاقي عبر الأطر الزمنية
يتم التعبير عن نافذة نظر واحدة في شموع إطار زمني مرجعي وتحويلها إلى عدد الشموع الخاص بكل فتحة، بحيث يتم قياس مسح 15 دقيقة ومسح ساعة واحدة عبر نفس فترة السوق. عندما تتفق عدة أطر زمنية، فإنها تصف فعلاً نفس الحدث.
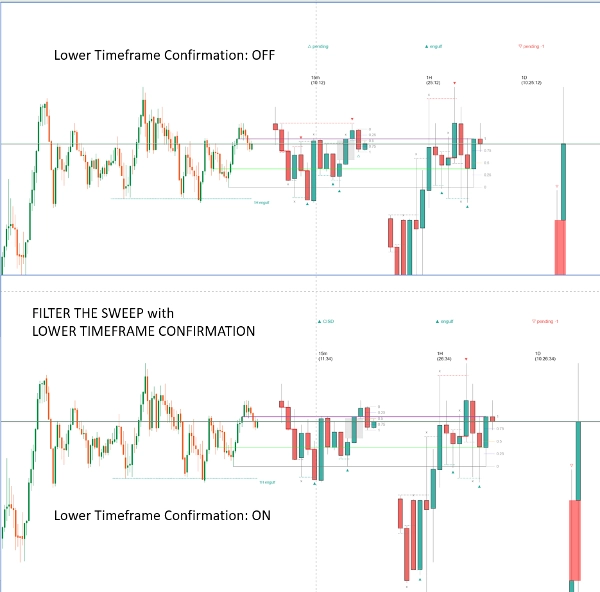
بوابة اختيارية تأخذ هذا أبعد: الأطر الزمنية أدنى من تقسيم تختاره لن تبلغ عن مسح إلا عندما يكون لدى إطار زمني أعلى منها مسح مباشر بالفعل، في نفس الاتجاه، عند سعر قابل للمقارنة. تتوقف الأطر الزمنية الأدنى عن الإبلاغ عن ضوضاء النطاق وتبدأ في تأكيد الحركة الأكبر.
المستويات التي تم مسحها على الرسم البياني الخاص بك
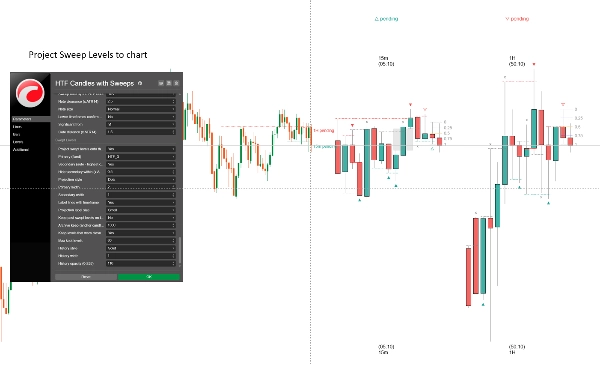
تعرض اللوحة الشموع؛ يعرض الرسم البياني السعر. يرسم المستوى الذي تم مسحه كخط أفقي يمتد من حيث تشكل الشمعة المرجعية فعليًا، إلى الآن — معنونًا بإطاره الزمني وحالته الحالية. يأتي الخط الأساسي من إطار زمني تحدده؛ يملأ الخط الثانوي تلقائيًا بأعلى إطار زمني آخر تم مسحه حاليًا.
يحتفظ أرشيف اختياري بالمستويات التي تم مسحها سابقًا على الرسم البياني بعد أن تخرج شمعتها من اللوحة، بحيث يمكنك النظر إلى الوراء على كيفية تصرف الكشف عبر الجلسة.
الاستخدام النموذجي
تداول من رسم بياني 5 دقائق أو 15 دقيقة بينما تجلس شموع الساعة و4 ساعات بجانبه. عندما يمسح إطار زمني أعلى مستوى ويؤكد، لديك اتجاه وسعر للعمل منه. عندما يتفق الإطار الزمني الأدنى، لديك تلاقي. عندما ينكسر مستوى بدلاً من ذلك، تخبرك العلامة بذلك أيضًا، وتتوقف عن انتظار انعكاس لن يحدث.
يناسب التداول بأسلوب مسح السيولة والأسلوب الذكي، والعمل على الاختراقات الفاشلة، وأي نهج مبني حول القمم والقيعان السابقة. مفيد عبر الفوركس، المؤشرات، المعادن والعملات الرقمية.
الإعدادات
— ست فتحات إطار زمني، كل منها بدقة، عدد الشموع، تبديل فيبوناتشي وتنسيق كامل
— تخطيط اللوحة: الحشو من السعر، عرض الشمعة، التباعد بين الشموع وبين الأطر الزمنية
— التسميات: اسم الإطار الزمني أعلى وأسفل، مؤقت العد التنازلي، قيم الفواصل، الأحجام والألوان
— الاختلال: فجوات القيمة العادلة واختلالات الحجم، ألوان قابلة للتعديل
— خطوط التتبع: أي فتحة، الشمعة الحالية أو السابقة، لون كل خط، النمط، العرض وتسميات السعر
— فيبوناتشي: ثمانية مستويات بقيم فردية، ألوان وتبديلات، بالإضافة إلى ثلاثة أوضاع مرساة ذكية
— كشف المسح: مرساة النظر للخلف والحد، الاتجاه، مسار التأكيد، حد العلامة لكل إطار زمني
— مظهر العلامة للحالات المعلقة، المؤكدة والمكسورة
— بوابة التلاقي: تقسيم الإطار الزمني وتحمل المسافة
— إسقاط الرسم البياني: الفتحة الأساسية، الثانوي التلقائي، الأنماط والتسميات
— الأرشيف: الاحتفاظ في شموع المرساة، الحد الأقصى المحتفظ به، التنسيق
لمن هو
المتداولون اليوميون والمتأرجحون الذين يعملون بالفعل من القمم والقيعان في الأطر الزمنية الأعلى ويريدون رؤيتها دون تبديل الرسوم البيانية. يفترض أنك تعرف ما هو مسح السيولة ولماذا يهم الاسترداد. إذا لم تكن المسوح جزءًا من كيفية قراءة الرسم البياني لديك، فلن يعلمك هذا كيفية تداولها.
ما لا يفعله
كوننا واضحين بشأن هذا الآن يوفر علينا الوقت لاحقًا:
— لا يعطي إشارات شراء أو بيع، ولا أسعار دخول أو وقف أو هدف
— لا يضع أوامر ولا يمكنه الوصول إلى حسابك — المؤشر يعمل بدون أي صلاحيات وصول
— لا يحتوي على تنبيهات أو إشعارات
— لا يتنبأ بأي شيء. كل علامة تصف شموعًا أغلقت بالفعل
— لا يعيد الرسم. يتم الحكم فقط على الشموع المكتملة، لذا لا تتغير العلامة بعد الحدث
— ليس استراتيجية. المسح المؤكد يصف ما فعله السعر، وليس ما يجب عليك فعله حيال ذلك
أمور تستحق المعرفة
يقرأ الكشف الشموع التي ترسمها كل فتحة فعليًا، لذا دائمًا ما يكون هناك شمعة على الشاشة لوضع علامة على مسح.
زيادة عدد شموع الفتحة توسع مدى النظر إلى الوراء.
تبدأ شموع الإطار الزمني الأعلى عند وقت خادم الوسيط الخاص بك. يمكن لوسيطين على نفس الأداة قطع الساعة أو اليوم في نقاط مختلفة، مما يعني أن نفس الرمز يمكن أن يُقرأ بشكل مختلف بشكل مشروع على منصتين. هذه خاصية للبيانات، وليست خطأ في المؤشر.
يمكن أن يكون المسح على الشمعة التي أغلقت مؤخرًا في حالة انتظار فقط — يحتاج التأكيد إلى شمعة لاحقة للإغلاق. في فتحة اليومية، يعني ذلك الانتظار يومًا.
التداول ينطوي على مخاطر. الأداء السابق لا يضمن النتائج المستقبلية.
الملخص
The indicator detects liquidity sweeps—candles that trade through previous highs or lows to capture resting orders—and tracks their resolution through four states: pending, confirmed by close inside the sweep’s range, confirmed by engulfing candle, or broken (breakout). These states are visually marked and only finalized on completed candles, ensuring no repainting.
Additional features include marking fair value gaps and volume imbalances between candles, trace lines linking higher timeframe candle levels to your chart, and configurable Fibonacci levels projected from selected higher timeframe candles with smart anchoring options.
Cross-timeframe confluence is supported by aligning sweep detection across multiple timeframes, with an optional gate to filter lower timeframe sweeps that confirm higher timeframe moves. Swept levels are drawn as horizontal lines on your chart with labels indicating timeframe and state, with an optional archive to retain past levels.
Designed for intraday and swing traders familiar with liquidity sweeps and higher timeframe analysis, it supports markets including forex, indices, metals, and crypto. The indicator does not provide trade signals, alerts, or order execution and operates solely as a visual analysis tool based on completed price data.
مناقشة
تقييمات العملاء
الأسئلة الشائعة
المزيد من هذا المؤلف




















السعر