


الوصف
المفهوم الرئيسي:
تدابير الدعم والمقاومة الكلاسيكية "رد الفعل": كم مرة انعكس السعر هنا؟ CCZ تقيس "القبول": كم من الوقت وافق السعر على التداول هنا؟
يقوم CCZ بقياس صادق: "كم شمعة على التوالي دون انقطاع قبلت هذا السعر؟"
الطريقة:
1. خذ شريحة من السعر الأخير وقسمها إلى نطاقات أفقية رقيقة، كل واحدة بارتفاع جزء من ATR الحالي. فكر فيها كأرفف.
2. لكل نطاق، استعرض الشموع واحتسب أطول سلسلة متواصلة يتقاطع نطاقها من الأعلى إلى الأدنى مع ذلك النطاق. شمعة واحدة تفوت النطاق تنهي السلسلة، ويبدأ العد من الصفر مرة أخرى.
3. أي نطاق يتجاوز أفضل سلسلة له عتبة — مثلاً ست شموع (أو حسب قواعد المستخدم) — يصبح منطقة.
قاعدة "على التوالي" هي الفكرة كلها. جدار من الشموع المتداخلة المتتالية هو تكوين — رف ذو قيمة عادلة.
─────────────────────────────────────
│ │ │ │ │ │ │ │
▓ ▓ ▓ ▓ ▓ ▓ ✗ ▓ ▓
1 2 3 4 5 6 فوت 1 2
└── 6 على التوالي ──┘ ↑ └ إعادة تعيين السلسلة
مؤهل فجوة
─────────────────────────────────────
قراءة المناطق
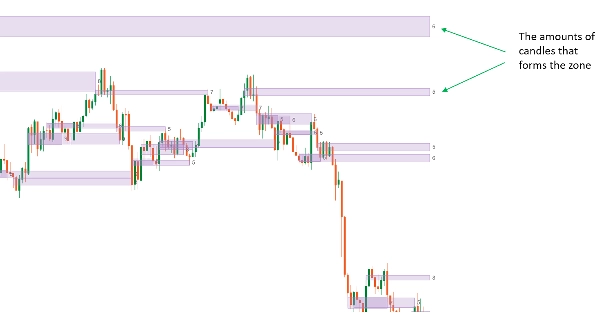
كل منطقة هي مستطيل يمتد عبر نطاق سعري، مع رقم مطبوع عليها. هذا الرقم هو طول أطول سلسلة متواصلة من الشموع التي لمست النطاق — درجة قوة المنطقة. الرقم "6" يعني ست شموع على التوالي شاركت ذلك السعر؛ و"12" هو مستوى أكثر تنافسية بكثير من "6".
يمتد الحافة اليمنى للمنطقة إلى الأمام طالما بقيت ذات صلة. بمجرد أن يتحرك السعر بعيدًا ثم يعود، يتم **تخفيف** المنطقة — تم اختبارها وتتوقف عن الامتداد. أنت تختار ما يعنيه "العودة":
- "لمس" — أي فتيلة تعود إلى المنطقة تخففها (صارم)
- "الإغلاق داخل" — فقط شمعة تغلق داخل المنطقة تُحسب (متساهل)
- "لمس ثم إغلاق داخل" — فتيلة أولاً، ثم شمعة لاحقة تغلق داخل المنطقة — يتجاهل الرفض بفتيلة واحدة
خيار إخفاء المناطق بمجرد تخفيفها يحافظ على الرسم البياني ليشمل فقط المستويات التي لا تزال قيد اللعب.
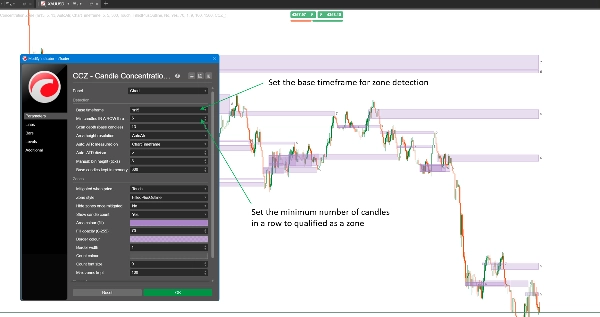
كشف المناطق على أي إطار زمني أساسي
الشموع التي يتم عدها لا يجب أن تكون شموع الرسم البياني الخاص بك. قم بتعيين إطار زمني أساسي مرة واحدة — أقل، مساوي، أو أعلى من رسمك البياني — ويتم بناء المناطق من شموع ذلك الإطار بغض النظر عن الرسم البياني الذي تشاهده.
شغله على شموع H1 أثناء التداول من رسم M5، وستجلس نفس المناطق المبنية على H1 على كلا الرسمين. قم بالتكبير إلى M1 وستظل نفس المستويات — أنت تنظر إلى عرض مكبر لكشف واحد، وليس كشف مختلف لكل إطار زمني.
الإعدادات
- الإطار الزمني الأساسي — مستقل عن الرسم البياني، أي دقة
- الحد الأدنى للشموع المتتالية المطلوبة لتأهيل المنطقة
- عمق الفحص — عدد شموع الأساس التي يغطيها النافذة المتحركة
- دقة ارتفاع المنطقة: تلقائي (مبني على ATR) أو يدوي (نقاط ثابتة)
- الوضع التلقائي: قياس ATR على إطار الرسم البياني أو الإطار الأساسي، بالإضافة إلى قاسم ATR لتحديد مدى ضيق النطاق الذي يُعتبر "نفس المستوى"
- الشموع الأساسية المحتفظ بها في الذاكرة
- قاعدة التخفيف: لمس / إغلاق داخل / لمس ثم إغلاق داخل
- نمط المنطقة: فقط الخط الخارجي، أو مملوء + الخط الخارجي، مع شفافية تعبئة مستقلة
- إخفاء المناطق بمجرد تخفيفها
- تسمية عد الشموع: تشغيل/إيقاف، اللون، حجم الخط
- لون وعرض الحدود، الحد الأقصى للمناطق المحتفظ بها، فحص أشرطة الرسم عند التحميل
الاستخدام النموذجي
استخدمه كرأي ثانٍ موضوعي على دعمك ومقاومتك الخاصة — يظهر المستوى فقط لأن الشموع أثبتت مرارًا أنه مهم، وليس لأنه يبدو مهمًا على الرسم البياني.
شغل الإطار الزمني الأساسي أعلى من رسم الدخول الخاص بك للتداول من أرفف إطار زمني أعلى نظيفة دون تبديل النوافذ للعثور عليها. أو طابقه مع إطار الرسم البياني الخاص بك لقراءة نقية لحركة السعر حيث يستمر الجلسة الحالية في الرفض.
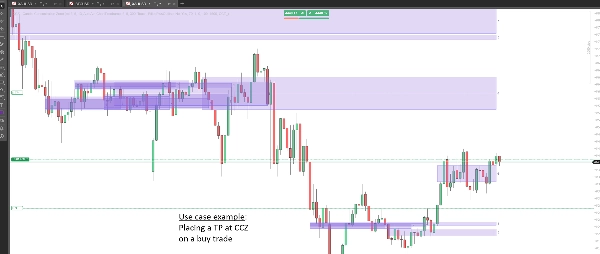
يتناسب بشكل طبيعي مع مشغل دخول منفصل: استخدم المناطق كتحيز لك حيث تبحث عن انعكاس أو اختراق، وإشارتك الخاصة عندما تتصرف بناءً عليه. في بعض الأحيان، يمكنك أيضًا قراءته كمنطقة هدف.
لمن هو
للمتداولين الذين يفكرون بالفعل بمصطلحات الدعم، المقاومة، أو مناطق العرض والطلب، ويريدون طريقة قائمة على القواعد للعثور على المناطق القوية بدلاً من الاعتماد على النظر إلى قمم وتقلبات السعر. مفيد من أطر الزمن السريعة حتى التداول المتأرجح، على الفوركس، المؤشرات، المعادن، أو العملات الرقمية. يفترض أنك لديك بالفعل طريقة لتحديد نقاط الدخول — هذه الأداة تجد المستويات، وليس المشغل.
ما لا تفعله
- لا تعطي إشارات شراء أو بيع، ولا أسعار دخول أو وقف أو هدف
- لا تضع أوامر ولا يمكنها الوصول إلى حسابك — المؤشر يعمل بدون أية صلاحيات
- لا تحتوي على تنبيهات أو إشعارات
- لا تعيد رسم التاريخ: فقط الشموع المغلقة تُحسب، ورقم قوة المنطقة لا يتغير بعد ذلك. الحافة اليمنى تستمر في الامتداد إلى الأمام مع كل شريط حتى يتم تخفيف المنطقة — هذا هو استمرار المنطقة حية، وليس إعادة رسم الماضي
أمور تستحق المعرفة
إذا قمت بتعيين الإطار الزمني الأساسي أعلى من إطار الرسم البياني الخاص بك، قم بتغيير "قياس ATR على" إلى الإطار الزمني الأساسي أيضًا. تركه على إطار الرسم البياني يقيس شمعة إطار زمني أعلى بمسطرة أصغر، مما يجعل نطاق السعر ضيقًا جدًا والمناطق نادرة جدًا للتشكل.
لا يمكن الحكم على المنطقة بأنها مخففة إلا بعد أن يغادرها السعر أولاً ثم يعود — المنطقة التي لا تزال تتشكل لا يمكن تخفيفها على شمعتها الأولى.
تبدأ شموع الإطار الزمني الأعلى الأساسي في وقت خادم الوسيط الخاص بك. يمكن لوسيطين أن يقطعوا نفس شمعة الإطار الزمني الأعلى في نقاط مختلفة بشكل مشروع، لذا يمكن أن تقرأ المناطق على نفس الرمز بشكل مختلف قليلاً عبر الوسطاء. هذه خاصية للبيانات، وليست خطأ في المؤشر.
التداول ينطوي على مخاطر. الأداء السابق لا يضمن النتائج المستقبلية.
الملخص
Key features include:
- Detection of zones from any user-defined base timeframe, independent of the chart timeframe, allowing higher timeframe zones to be viewed on lower timeframe charts.
- Zones are displayed as rectangles with a strength score indicating the longest consecutive candle count overlapping the zone.
- Mitigation rules determine when a zone is considered tested and no longer extends forward, with options for strict or lenient definitions based on candle touches or closes.
- Customizable settings such as minimum candles in a row, scan depth, band height resolution, zone style, and label display.
- Designed for traders who use support, resistance, or supply and demand concepts and want an objective, rule-based method to identify strong levels.
- Supports markets including forex, indices, metals, and crypto across scalping to swing trading timeframes.
- The indicator does not provide trade signals, alerts, or order execution capabilities and does not repaint historical data.
CCZ serves as a tool to objectively highlight price consolidation zones that can be used as bias areas for potential reversals or breakouts.
تقييمات العملاء
مناقشة
الأسئلة الشائعة
المزيد من هذا المؤلف


















السعر