


Mô tả
Nó làm gì
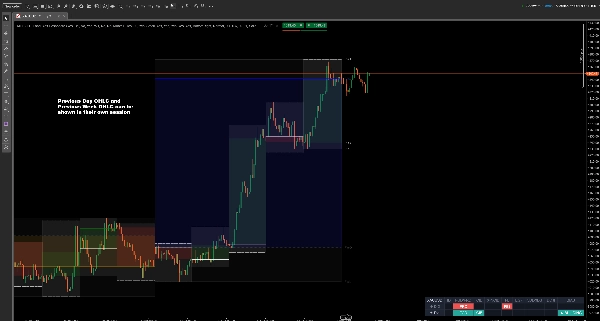
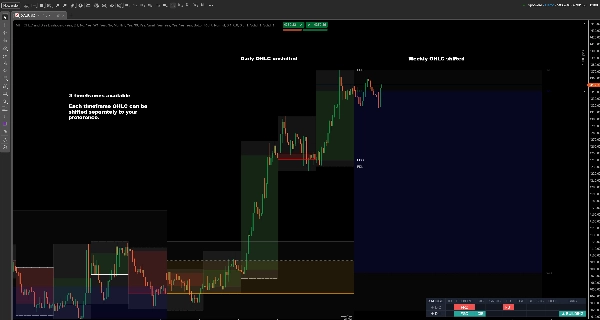
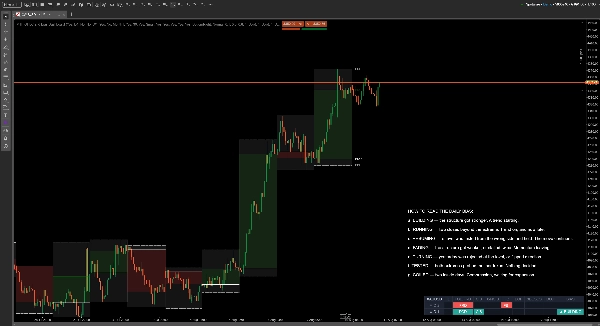
BẢNG ĐIỀU KHIỂN OHLC VÀ BIAS ĐA KHUNG THỜI GIAN là một chỉ báo hành động giá đa khung thời gian dành cho cTrader. Nó vẽ các mức OHLC của ngày trước, tuần trước và tháng trước — mở cửa, cao, thấp và đóng cửa — lên biểu đồ của bạn, và thêm một bảng điều khiển đọc những gì giá thực sự đã làm tại các mức đó trong hai ngày hoàn thành gần nhất.
Mức cao và thấp của ngày trước (PDH và PDL), giá mở cửa hàng ngày, mức cao và thấp hàng tuần: đây là các mức hỗ trợ và kháng cự khung thời gian cao hơn mà hầu hết các nhà giao dịch trong ngày và giao dịch dao động đã làm việc từ đó. Những gì họ thường làm bằng mắt mỗi sáng là so sánh chúng — ngày hôm qua đóng cửa có cao hơn ngày trước đó không? Giá có vượt qua mức cao của ngày trước và thất bại không? Di chuyển có đang xây dựng hay sắp hết không gian? Chỉ báo này trả lời những câu hỏi đó trên biểu đồ, trong một hàng duy nhất.
Các mức OHLC đa khung thời gian
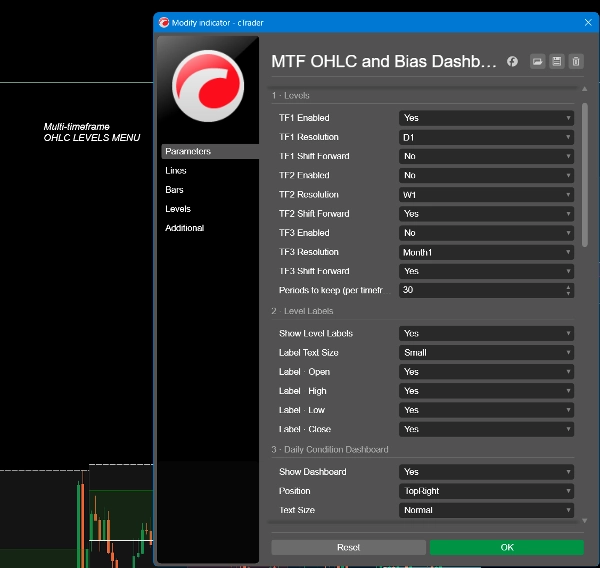
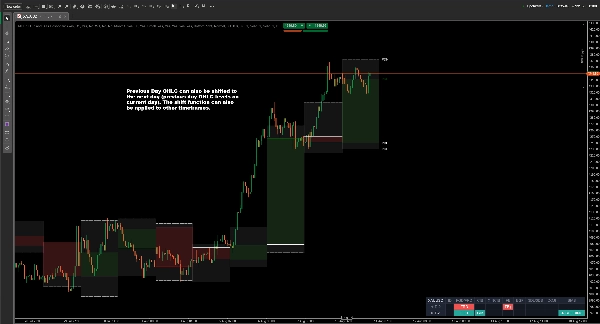
Lên đến ba khung thời gian cùng lúc — hàng ngày, hàng tuần, hàng tháng, hoặc bất kỳ độ phân giải nào bạn chọn. Mỗi khung vẽ mức mở cửa, cao, thấp và đóng cửa của nó, với tùy chọn thân nến được tô bóng và một dải từ cao đến thấp. Các mức có thể được dịch chuyển về phía trước để tham chiếu của kỳ hiện tại nằm trước giá thay vì phía sau, và bạn có thể giữ đến 70 kỳ lịch sử trên biểu đồ.
Mỗi đường có màu sắc, độ dày và kiểu riêng, vì vậy mức hỗ trợ hàng tuần sẽ không bao giờ bị nhầm lẫn với mức hàng ngày.
Bảng điều khiển điều kiện hàng ngày
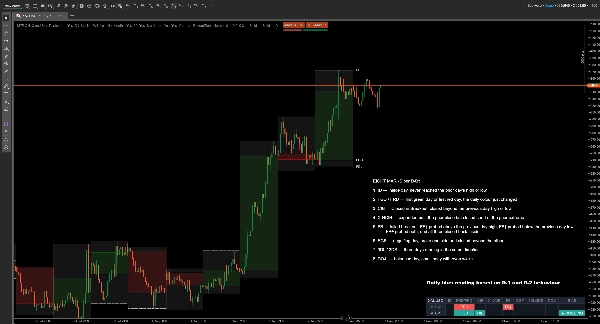
Bảng điều khiển đánh giá hai cây nến hàng ngày hoàn thành gần nhất — D-1 (hôm qua) và D-2 (ngày trước đó) — mỗi cây so với ngày liền trước nó.
Chín dấu mỗi ngày:
- ID — ngày bên trong, không bao giờ chạm đến mức cao hoặc thấp của ngày trước
- FGD / FRD — ngày xanh đầu tiên hoặc ngày đỏ đầu tiên, màu sắc hàng ngày vừa thay đổi (Xanh là ngày tăng và Đỏ là ngày giảm)
- CIB — Đóng cửa trong đột phá, đóng cửa vượt qua mức cao hoặc thấp của ngày trước
- X-NCIB — mở rộng vượt qua mức đóng cửa trước nhưng đóng cửa chưa đến cực đoan trước đó (Expand Not Closed In Breakout = X-NCIB)
- FB — đột phá thất bại: FB↑ thử vượt mức cao của ngày trước, FB↓ thử xuống dưới mức thấp của ngày trước, FB± thử cả hai, và cả ba đều đóng cửa lại bên trong
- EGF — ngày bao phủ, phá vỡ một bên và đóng cửa vượt bên kia
- 3DL / 3DS — ba ngày liên tiếp theo cùng một hướng (3 Ngày Tăng = 3DL/ 3 Ngày Giảm = 3DS)
- DOJI — ngày cân bằng, thân nhỏ với bấc đều
- BIAS — kết quả đọc, giải thích bên dưới
Cách đọc bias hàng ngày
Bias là phần giúp bạn tiết kiệm công sức. Mỗi ngày được thu gọn thành một trạng thái duy nhất, và bias đến từ sự di chuyển giữa D-2 và D-1 — không chỉ từ ngày hôm qua. Cùng một dấu hiệu có thể mang ý nghĩa khác nhau tùy thuộc vào những gì đã xảy ra trước đó, và đó chính là điều mà một bảng điều khiển ngày đơn không thể cho bạn biết.
- XÂY DỰNG — cấu trúc trở nên mạnh hơn. Một xu hướng bắt đầu.
- CHẠY — hai lần đóng cửa vượt qua cực đoan. Xu hướng tiếp diễn, và giờ đã muộn.
- TIẾP TỤC — một mức đã được thử nghiệm từ phía sai và giữ vững. Di chuyển tiếp tục.
- GIẢM — cấu trúc yếu đi, hoặc bị đình trệ hai lần. Đà giảm.
- ĐẢO CHIỀU — ngày hôm qua bị từ chối tại mức đó, hoặc đổi hướng.
- ĐÃ THỬ NGHIỆM — cả hai cực đoan đều được thử, không bên nào bị lấy đi. Chưa có quyết định.
- NÉN — hai ngày bên trong. Nén lại, chờ mở rộng.
Một mũi tên và màu sắc thể hiện hướng: màu xanh lên cho tăng, màu đỏ xuống cho giảm, màu xám trung tính khi không có hướng để cho.
Cả hai hàng chi tiết vẫn hiển thị trên bias, vì vậy bạn luôn có thể thấy lý do tại sao nó đọc như vậy thay vì tin tưởng một hộp đen.
Sử dụng điển hình
Mở biểu đồ vào buổi sáng, đọc bias, và biết trước khi phiên bắt đầu bạn đang tìm kiếm sự tiếp diễn, giảm dần hay phạm vi. Sau đó giao dịch theo các thiết lập của bạn dựa trên các mức đã vẽ — mức cao và thấp của ngày trước, giá mở cửa hàng ngày, các cực đoan hàng tuần.
Nó phù hợp cho công việc phạm vi mở cửa, giao dịch đột phá thất bại, và các chiến lược tiếp diễn ngày qua ngày. Hữu ích trên forex, chỉ số, kim loại và tiền điện tử.
Cài đặt
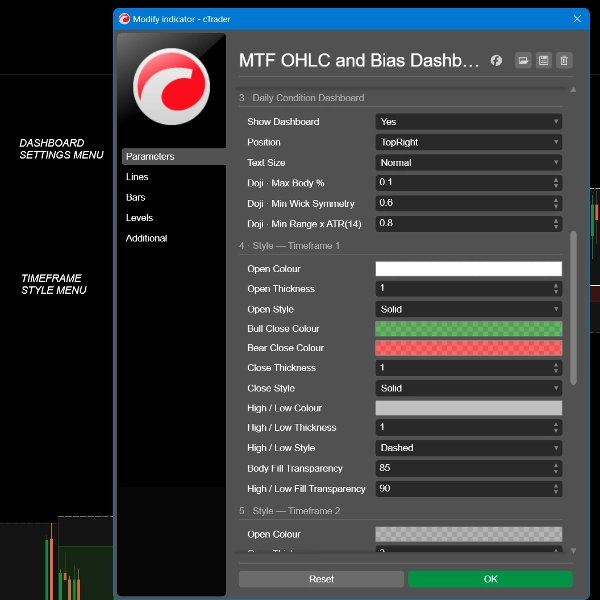
- Ba khe khung thời gian độc lập, mỗi khe có độ phân giải riêng, công tắc dịch chuyển về phía trước và điều khiển đầy đủ màu sắc, độ dày và kiểu dáng
- Số kỳ lịch sử để giữ, tối đa 70
- Nhãn mức bật hoặc tắt, theo loại đường, với kích thước chữ có thể điều chỉnh
- Bảng điều khiển bật hoặc tắt, năm vị trí màn hình, bốn kích thước chữ
- Độ nhạy Doji: tỷ lệ thân tối đa, đối xứng bấc tối thiểu, phạm vi tối thiểu so với trung bình 14 ngày
******************************************************
Dành cho ai
Các nhà giao dịch trong ngày và giao dịch dao động đã làm việc với các mức ngày trước và tuần trước. Nó giả định bạn biết mức cao của ngày trước là gì và tại sao nó quan trọng. Nếu những mức đó chưa phải là một phần trong cách bạn giao dịch, thì công cụ này sẽ không dạy bạn cách sử dụng chúng.
Những gì nó không làm
Rõ ràng điều này ngay bây giờ sẽ giúp cả hai chúng ta tiết kiệm thời gian sau này:
- Nó không đưa ra tín hiệu mua hoặc bán, cũng không có giá vào hoặc ra
- Nó không đặt lệnh và không thể truy cập tài khoản của bạn — chỉ báo chạy mà không có quyền truy cập nào cả
- Nó không có cảnh báo hoặc thông báo
- Nó không dự đoán gì. Mỗi dấu hiệu mô tả các cây nến đã đóng
- Nó không vẽ lại. Bảng điều khiển chỉ đọc các cây nến hàng ngày đã hoàn thành, vì vậy kết quả đọc không bao giờ thay đổi sau đó
- Nó không phải là một chiến lược. Bias mô tả cấu trúc; nó không khuyến nghị giao dịch
********************************************************
Những điều cần biết
Bảng điều khiển cần ít nhất bốn cây nến hàng ngày hoàn thành, vì vậy một biểu tượng mới niêm yết sẽ hiển thị dấu gạch ngang cho đến khi có đủ lịch sử.
Cây nến hàng ngày bắt đầu theo giờ máy chủ của nhà môi giới bạn. Hai nhà môi giới trên cùng một công cụ có thể cắt ngày vào các giờ khác nhau, điều này có nghĩa là cùng một biểu tượng có thể đọc khác nhau hợp lệ trên hai nền tảng. Đó là đặc tính của dữ liệu, không phải lỗi của chỉ báo.
Trên khung thời gian hàng ngày, bảng điều khiển không thể đọc dữ liệu hàng ngày và hiển thị cảnh báo TF > D. Các mức vẫn được vẽ.
Giao dịch có rủi ro. Hiệu suất trong quá khứ không đảm bảo kết quả trong tương lai.
Tóm tắt
A central feature is the two-day price action bias dashboard, which analyzes the last two completed daily candles relative to their preceding days. It categorizes daily price behavior into nine distinct patterns (e.g., inside day, first green/red day, failed breakout, engulfing day) and summarizes the overall bias into states such as building, running, fading, or turning. Directional bias is indicated with colored arrows (green for bullish, red for bearish, grey for neutral), helping traders quickly assess market structure without guesswork.
Designed for intraday and swing traders familiar with previous day and week levels, the indicator does not provide trade signals, alerts, or order execution. It is suitable for forex, indices, metals, and cryptocurrencies, aiding strategies like opening-range, failed-breakout, and continuation trading by clearly marking key levels and daily price action context.
Thảo luận
Đánh giá của khách hàng
Câu hỏi thường gặp
Sản phẩm khác của tác giả này
















![Logo "Gaussian Channel [Iridio Capital]"](https://cdn.ctrader.com/image/webp/2c4f9ca9-4e9b-476d-b5a6-787c8095032b_61546)



Giá