
Hammer Pattern Indicator
อินดิเคเตอร์
282 ดาวน์โหลด
เวอร์ชัน 1.0, Mar 2025
Windows, Mac
5.0
รีวิว: 1
คำอธิบาย
ตัวบ่งชี้รูปแบบค้อน – คำอธิบายกลยุทธ์
ตัวบ่งชี้ รูปแบบค้อน นี้เป็น สัญญาณกลับตัวที่อิงจากแท่งเทียน ที่ระบุ รูปแบบค้อนขาขึ้น ในแนวโน้มขาลง ออกแบบมาเพื่อจับการกลับตัวของแนวโน้มที่อาจเกิดขึ้นและเน้น โอกาสในการซื้อ.
วิธีการทำงาน
1️⃣ ตรวจจับแนวโน้มขาลง
- ราคาปิดของแท่งเทียนต้องต่ำกว่าราคาปิดเมื่อ 3 แท่งก่อนหน้า ซึ่งบ่งชี้ถึงแนวโน้มขาลงที่อาจเกิดขึ้น
2️⃣ ตรวจสอบโครงสร้างแท่งเทียนรูปแบบค้อน
- ตัวแท่งเล็ก: ตัวแท่งเทียนมีขนาดเล็กเมื่อเทียบกับช่วงทั้งหมด (≤ 30% ของช่วงทั้งหมด)
- เงาด้านล่างยาว: ไส้เทียนด้านล่างมีความยาวอย่างน้อย 2 เท่าของขนาดตัวแท่ง (แสดงถึงการปฏิเสธราคาที่ต่ำลงอย่างแรง)
- เงาด้านบนสั้น: ไส้เทียนด้านบนมีความยาว ≤ 30% ของขนาดตัวแท่ง (บ่งชี้ถึงแรงต้านที่น้อยด้านบน)
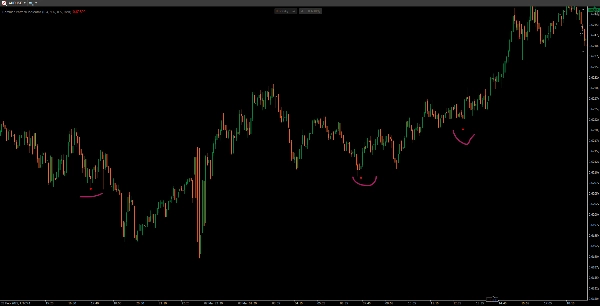
3️⃣ แสดงสัญญาณซื้อ
- หากเงื่อนไขทั้งหมดเป็นจริง จะมี จุดสีแดง (หรือสีที่เลือก) ปรากฏขึ้น เล็กน้อยต่ำกว่าจุดต่ำสุดของแท่งเทียนรูปแบบค้อน เพื่อเป็น การยืนยันด้วยภาพ ของการกลับตัวที่อาจเกิดขึ้น
คุณสมบัติหลัก
✅ กรองสัญญาณอ่อน โดยการยืนยันแนวโน้มขาลงก่อนหน้า
✅ พารามิเตอร์ปรับแต่งได้ สำหรับขนาดตัวแท่ง ความยาวเงา และสี
✅ รูปแบบแท่งเทียนที่เรียบง่ายแต่มีประสิทธิภาพ สำหรับนักเทรดสวิงและนักเทรดตามราคาตลาด
📌 การใช้งานที่ดีที่สุด: ยืนยันรูปแบบค้อนด้วยตัวบ่งชี้เพิ่มเติม (เช่น ปริมาณการซื้อขาย, ระดับแนวรับ) เพื่อสัญญาณที่แข็งแกร่งขึ้น! 🚀
สรุป
โปรไฟล์อินดิเคเตอร์
รีวิวจากลูกค้า
5.0
รีวิว: 1
5 | 100 % | |
4 | 0 % | |
3 | 0 % | |
2 | 0 % | |
1 | 0 % |
รีวิวจากลูกค้า
August 18, 2025
Automatically detects hammer candlesticks, customizable, lightweight. Cons: No trend filter, no reliability scoring, possible false signals on low TFs.
การสนทนา
คำถามที่พบบ่อย
Signal
ผลิตภัณฑ์ที่มีให้บริการผ่าน cTrader Store รวมถึงบอทการเทรด อินดิเคเตอร์ และปลั๊กอิน มีให้บริการโดยนักพัฒนาบุคคลที่สามและมีไว้เพื่อวัตถุประสงค์ในการเข้าถึงข้อมูลและทางเทคนิคเท่านั้น cTrader Store ไม่ใช่โบรกเกอร์และไม่ได้ให้คำแนะนำการลงทุน คำแนะนำส่วนบุคคล หรือการรับประกันผลการดำเนินงานในอนาคต


ราคา
ตั้งแต่ 21/02/2025
466.3M
ปริมาณการเทรด
180.83K
Pips ที่ได้กำไร
22
การขาย
6.92K
ติดตั้งฟรี