
// ══════════════════════════════════════ ══════════════════════════════════════
// 📊 GÖSTERGE EMA ZAMAN ÇERÇEVESİNDE (ÇOKLU ZAMAN ÇERÇEVESİ)
// Sürüm: 1.0.0 - Çoklu zaman çerçevesi analizi için profesyonel gösterge
// Yazar: Fury Team - Armando Brecciaroli
// Tarih: 5 Haziran 2025
// ══════════════════════════════════════════════════════════════════════════
//
// AÇIKLAMA:
// ===========
// EMA on TF, belirli bir zaman çerçevesinde hesaplanan üssel hareketli ortalamayı (EMA)
// mevcut grafik zaman çerçevesine yansıtan gelişmiş bir göstergedir.
// Bu araç, daha yüksek zaman çerçevelerinin hareketli ortalamalarını (ör. H4, D1)
// daha düşük zaman çerçevelerinde (M15, H1) bile kullanmanıza olanak tanır,
// böylece eksiksiz ve anlık çoklu zaman çerçevesi analizi sağlar.
//
// TEMEL ÖZELLİKLER:
// ==========================
// - Herhangi bir zaman çerçevesinin EMA'sını mevcut grafikte gösterme
// - cTrader'da mevcut tüm zaman çerçeveleri için tam destek
// - EMA periyodu ve fiyat kaynağının tam özelleştirilmesi
// - Esnek konumlandırma ile bilgi etiketi yönetimi
// - Güvenli lisanslama sistemi ve otomatik güncelleme kontrolü
// - Büyük veri setlerinde bile yüksek performans için tam optimize
// - Görsel görünümün tam özelleştirilmesi (renkler, çizgi stili)
//
// PRATİK KULLANIMLAR:
// ================
// - Daha düşük zaman çerçevesi grafiğinde uzun vadeli trendi belirleme
// - Daha yüksek zaman çerçevelerinin önemli ortalamalarını gösterme
// - Hareketli ortalamalara dayalı çoklu zaman çerçevesi stratejileri oluşturma
// - Daha güvenilir dinamik destek ve dirençleri belirleme
//
// DEĞİŞİKLİKLER:
// =========
// v1.0.0 (05/06/2025)
// - Tüm zaman çerçeveleri için tam destek ile ilk sürüm
// - Gelişmiş lisans yönetim sistemi uygulaması
// - Bilgilendirici HUD ile özelleştirilebilir kullanıcı arayüzü
// - Grafikte bilgilendirici etiket eklendi
// - Entegre otomatik güncelleme sistemi
// - Uzun zaman serileri için performans optimizasyonu
// - Tüm fiyat kaynakları için destek (Kapanış, Açılış, Yüksek, Düşük, vb.)
// - Sistem mesajı gösteriminin otomatik yönetimi
// ═══════════════════════════════════════════════════════════════════════════════
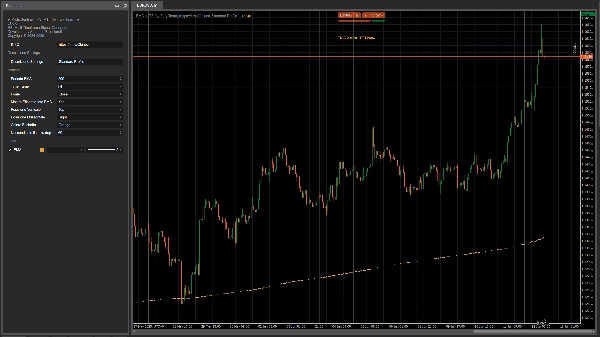
Lisansı etkinleştirmek için ekrandaki veya günlüklerdeki bilgileri takip edin.
5 | 0 % | |
4 | 100 % | |
3 | 0 % | |
2 | 0 % | |
1 | 0 % |


!["Gaussian Channel [Iridio Capital]" logosu](https://cdn.ctrader.com/image/webp/7c039209-5573-4a54-a072-f9528b503103_41960)

