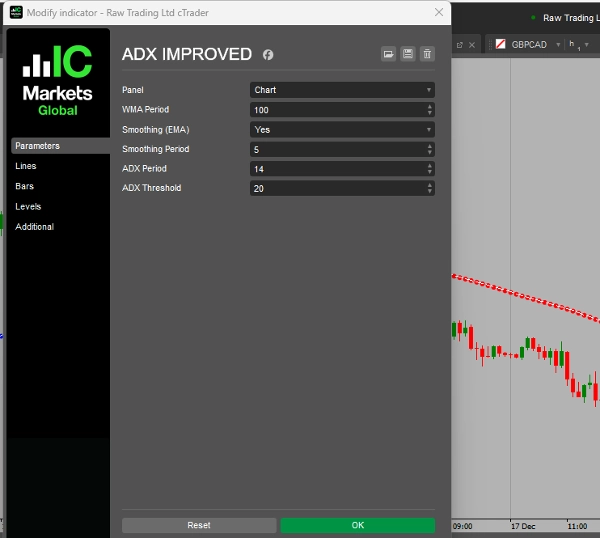
ADX IMPROVED
Indikator
Version 1.0, Aug 2025
Windows, Mac
Beschreibung
Der SmartADXWMAIndicator ist ein vielseitiges benutzerdefiniertes Werkzeug für die technische Analyse. Er kombiniert zwei Kernkomponenten, um Händlern zu helfen, Markttrends zu erkennen und zu folgen:
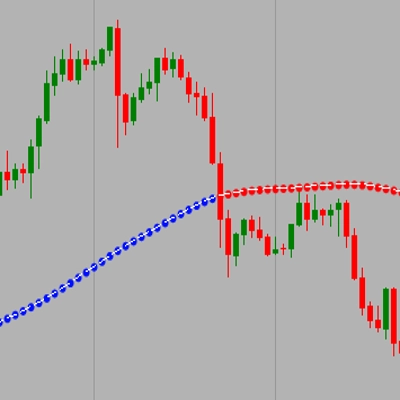
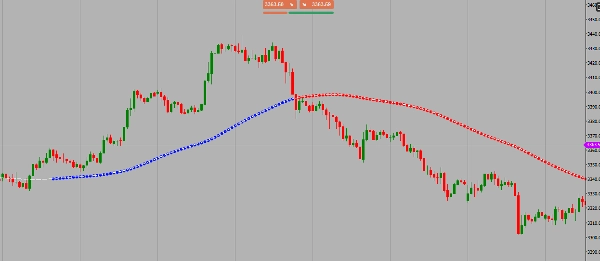
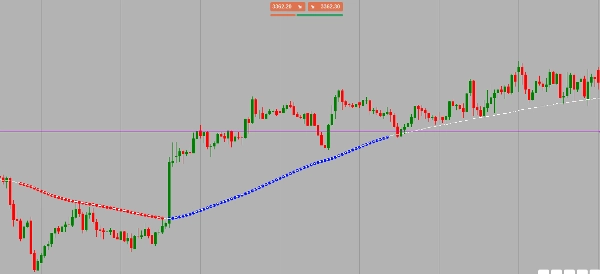
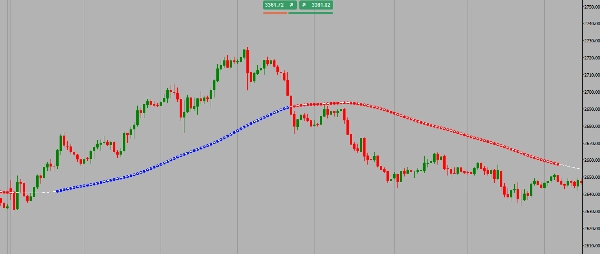
- Eine geglättete Trendlinie: Der Indikator berechnet einen gewichteten gleitenden Durchschnitt (WMA) des Schlusskurses. Anschließend wird ein exponentieller gleitender Durchschnitt (EMA) auf diesen WMA angewendet, wodurch eine einzelne, glatte Linie im Chart entsteht. Diese Linie ist so konzipiert, dass sie sehr reaktionsschnell auf die jüngste Kursentwicklung reagiert und gleichzeitig kleinere Schwankungen herausfiltert, sodass Sie eine klare visuelle Darstellung der aktuellen Trendrichtung erhalten.
- Signaldots zur Trendbestätigung: Er verwendet den Average Directional Index (ADX), einen fortgeschrittenen Momentum-Indikator, um die Stärke des Trends zu bestätigen. Wenn der ADX-Wert über einen benutzerdefinierten Schwellenwert steigt, signalisiert dies, dass sich der Markt in einem starken, anhaltenden Trend befindet.
Wie es zusammenarbeitet
Die Stärke des Indikators liegt in seinem kombinierten Ansatz. Er zeigt nicht nur eine Trendlinie, sondern liefert auch präzise visuelle Signale.
- Ein grüner Punkt erscheint direkt auf der Trendlinie, wenn der ADX über dem Schwellenwert liegt und der Preis über der Trendlinie liegt, was einen starken Aufwärtstrend bestätigt.
- Ein roter Punkt erscheint, wenn der ADX über dem Schwellenwert liegt und der Preis unter der Trendlinie liegt, was einen starken Abwärtstrend bestätigt.
Diese Kombination ermöglicht es Händlern, leicht zu erkennen, wann sich ein Markt in einem Trend befindet, in welche Richtung er sich bewegt und wann sie möglicherweise einen Handels-Einstieg oder -Ausstieg in Betracht ziehen sollten, basierend auf der Beziehung zwischen Preis und Trendlinie.
Für Swing-Trading können Sie WMA 100 und Schwellenwert 20 oder 25 ausprobieren.
Zusammenfassung
Indikatorprofil
Kundenbewertungen
0.0
Bewertungen: 0
Kundenbewertungen
Bisher gibt es keine Bewertungen für dieses Produkt. Haben Sie es schon ausprobiert? Dann können Sie die erste Person sein, die andere darüber informiert!
Diskussion
Häufig gestellte Fragen (FAQ)
Über den cTrader Store verfügbare Produkte, einschließlich Handelsbots, Indikatoren und Plugins, werden von externen Entwicklern bereitgestellt und nur zu Informations- und technischen Zugriffszwecken verfügbar gemacht. cTrader Store ist kein Broker und erbringt keine Anlageberatung, persönlichen Empfehlungen oder eine Garantie für zukünftige Performance.


Preis
Seit 15/12/2024
3.6M
Gehandeltes Volumen
2.05M
Pip-Gewinn