
ADX and ADI
Indikator
258 downloads
Version 1.0, Aug 2025
Windows, Mac
5.0
Bewertungen: 2
Seit 21/02/2025
466.3M
Gehandeltes Volumen
180.83K
Pip-Gewinn
21
Verkäufe
6.77K
Kostenlose Installationen
Hauptmerkmale:
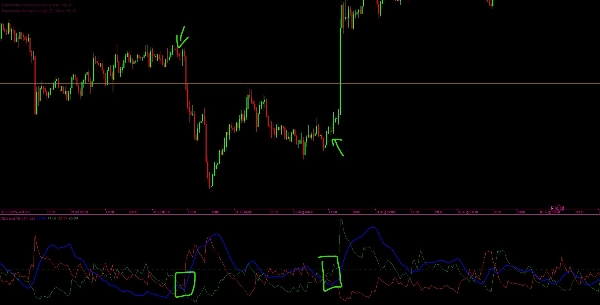
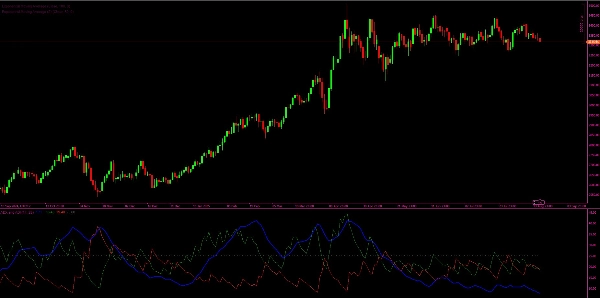
- ADX- und ADI-Linie (Blau): Zeigt die geglättete Stärke des aktuellen Trends, unabhängig von der Richtung.
- +DI-Linie (Grün): Zeigt die Stärke der Aufwärtsbewegungen an.
- -DI-Linie (Rot): Zeigt die Stärke der Abwärtsbewegungen an.
- Schwellenwert-Linie (Grau): Eine horizontale Referenzlinie (Standard 25), die hilft zu erkennen, ob die Trendstärke signifikant ist.
Funktionsweise:
- Der Indikator berechnet True Range (TR), Positive Directional Movement (+DM) und Negative Directional Movement (-DM).
- Er wendet Wilders Glättungstechnik an, um die geglätteten Werte von TR, +DM und -DM zu berechnen.
- Aus diesen werden die Directional Indicators (+DI und -DI) abgeleitet, die zeigen, welche Seite (bullisch oder bärisch) stärkere Dynamik hat.
- Der DX (Directional Index) wird aus der relativen Differenz zwischen +DI und -DI berechnet.
- Schließlich wird der ADX (Average Directional Index) als geglättete Version von DX berechnet und liefert eine Messung der gesamten Trendstärke.
Interpretation:
- Wenn der ADX über dem Schwellenwert (z. B. 25) liegt, gilt der Markt als stark trendend.
- Wenn +DI > -DI, haben die Bullen die Kontrolle (Aufwärtstrend).
- Wenn -DI > +DI, haben die Bären die Kontrolle (Abwärtstrend).
- Wenn der ADX unter dem Schwellenwert liegt, gilt der Markt als seitwärts tendierend (schwacher oder kein Trend).
Indikatorprofil
5.0
Bewertungen: 2
5 | 100 % | |
4 | 0 % | |
3 | 0 % | |
2 | 0 % | |
1 | 0 % |
Kundenbewertungen
December 1, 2025
ADX and ADI delivers clean trend strength and direction signals. ADX shows when the market is actually trending, while +DI and -DI reveal who’s in control. Stable, lightweight and reliable across all timeframes. Best on H1+ for smoother signals. Alerts and zone-highlighting would be great additions.
September 12, 2025
Über den cTrader Store verfügbare Produkte, einschließlich Handelsbots, Indikatoren und Plugins, werden von externen Entwicklern bereitgestellt und nur zu Informations- und technischen Zugriffszwecken verfügbar gemacht. cTrader Store ist kein Broker und erbringt keine Anlageberatung, persönlichen Empfehlungen oder eine Garantie für zukünftige Performance.


Seit 21/02/2025
466.3M
Gehandeltes Volumen
180.83K
Pip-Gewinn
21
Verkäufe
6.77K
Kostenlose Installationen