Beschreibung
⚠️ Wir sind umgezogen zu 👉 PrimeQuant
🚫🚫🚫 Kaufen Sie diesen Indikator nicht!
Dieser OHLC PRO von LudwigICT Indikator ist ein multifunktionales Chart-Overlay-Tool, das eine professionelle, informationsreiche Visualisierung auf Ihrem cTrader-Chart bietet.
Hier eine Übersicht dessen, was es tut:
🔹 Kernfunktion: OHLC Overlay
- Zeichnet benutzerdefinierte OHLC (Open, High, Low, Close) Balken in Ihrem Chart.
- Sie können einstellen:
-
- Welchen Zeitrahmen OHLC Sie verwenden möchten (Täglich, Wöchentlich, Monatlich oder intraday wie H1, M15 usw.).
- Balkenversatz (Abstand von aktuellen Kerzen).
- Balkenbreite, Docht, Ränder und benutzerdefinierte Farben.
- Effektiv erhalten Sie „Referenzkerzen“ von höheren Zeitrahmen, die auf Ihrem aktuellen Chart platziert sind.
🔹 Triple-M Setup (Bullische/Bärische Signale)
- Erkennt ein Muster aufeinanderfolgender höherer Tiefs (bullisch) oder niedrigerer Hochs (bärisch).
- Wenn erkannt:
-
- Kann Dreieckssymbole (auf oder ab) auf den Kerzen platzieren.
- Kann auch Balken umfärben, um einen Momentumwechsel zu zeigen.
- Dies fungiert als Signal für eine Verschiebung der Momentumstruktur.
🔹 Duale ZigZag-Werkzeuge
- Zwei unabhängige ZigZag-Overlays:
-
- ZigZag #1 (längere Länge, z.B. Swing-Struktur).
- ZigZag #2 (kürzere Länge, z.B. Mikro-Swings).
- Hebt Marktschwünge für Struktur-, Trend- und Ausbruchsanalysen hervor.
🔹 Gann Unterstützung & Widerstand
- Verwendet eine Gann-Zahlentabelle + ATR-Logik zur Berechnung von S/R-Niveaus.
- Zeichnet mehrere Unterstützungs-/Widerstandslinien ober- und unterhalb des Preises.
- Linien können gestaltet werden (durchgezogen, gepunktet, nach links verlängert usw.).
- Beschriftet Niveaus mit Preiswerten.
- Bietet auch Bereichsführer:
-
- „Vorheriger Bereich“ vs. „Nächster Bereich“ relativ zum ATR.
- Hilft bei der Prognose von Expansions- oder Kontraktionszonen.
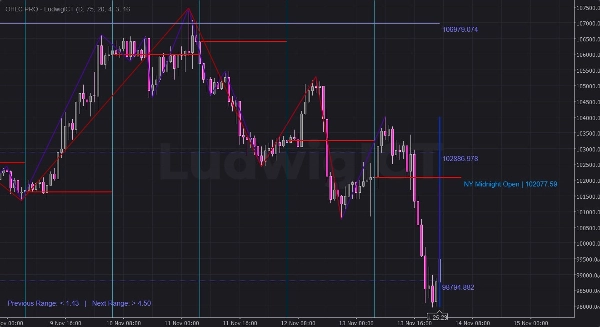
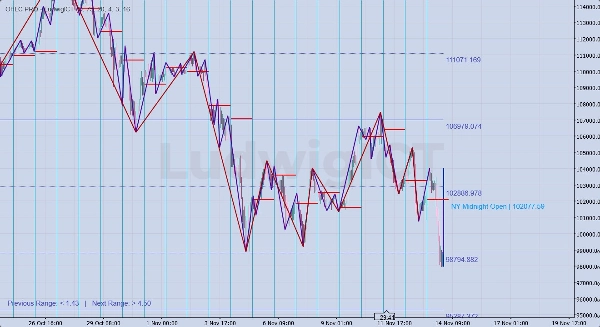
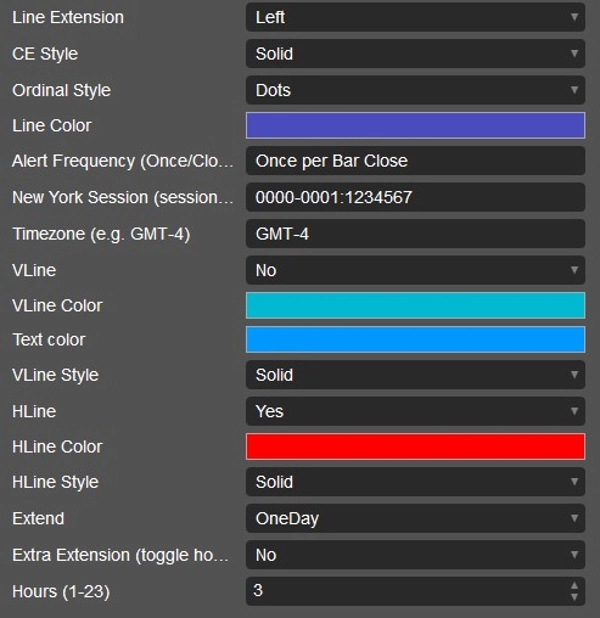
🔹 New York Mitternachtsniveaus
- Erkennt automatisch den Mitternachts-Eröffnungspreis der New York Session.
- Zeichnet:
-
- Horizontale Linie am NY Mitternachts-Eröffnungspreis.
- Vertikale Linie zum Sitzungsbeginn.
- Beschriftungen mit „NY Midnight Open | Preis“.
- Sie können diese Linien für 1 oder 2 Tage verlängern oder zusätzliche Stunden hinzufügen.
- Nützlich für ICT-Style Trading (New York Session Bias, Gleichgewichtspunkte usw.).
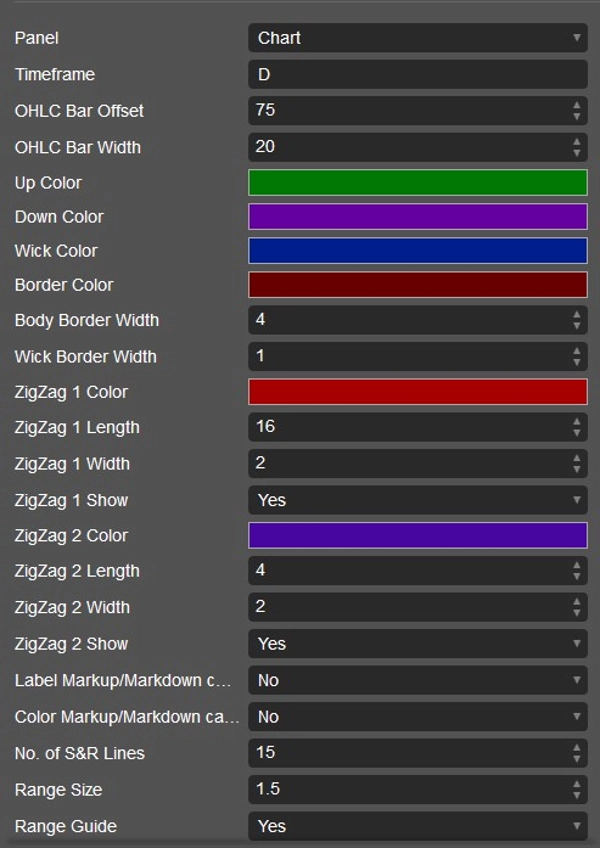
🔹 Anpassung & Alarme
- Jede Funktion hat Parameter in Dropdown-Menüs:
-
- Farben, Stile, Linienverlängerungen, Anzahl der Linien usw.
- Alarme werden unterstützt (hauptsächlich über Chart-Visuals – Alarmfrequenz-Parameter ist vorhanden).
- Saubere Entfernung beim Schließen des Indikators (damit Ihr Chart nicht überladen bleibt).
✅ Kurz gesagt:
Dieser Indikator ist ein multifunktionales Preisaktions-Tool. Er kombiniert:
- OHLC-Kerzen höherer Zeitrahmen
- Momentum-Mustersignale (Triple-M)
- Zwei ZigZag-Strukturen
- Gann S/R-Niveaus + Bereichsführer
- New York Session Mitternachts-Eröffnungsmarkierungen
Es ist gemacht für struktur-, sessions- und niveaubasiertes Trading, besonders nützlich für ICT-Style- oder Preisaktions-Trader.
Ich erkläre wie Sie es praktisch beim Trading von XAU/USD nutzen können
🔹 Praktische Trading-Nutzung (Gold mit OHLC PRO)
1. OHLC Overlay höherer Zeitrahmen
- Beispiel: Zeichnen Sie tägliches OHLC beim Trading auf M5/M15.
- Sie sehen die Kerze von gestern „innerhalb“ Ihres Intraday-Charts.
- Verwendung:
-
- Preis nähert sich dem Hoch/Tief des Vortages = Liquiditätsjagd-Bereich.
- Tägliche Eröffnung/Schluss = Bias-Filter (darüber = bullisch, darunter = bärisch).
- Hilft Ihnen, innerhalb der täglichen Range zu handeln.
👉 Beim Gold greift die NY-Session oft das Hoch/Tief des Vortages an, bevor sie sich umkehrt.
2. Triple-M Signale
- Das Triple-M-Muster (Serie von steigenden Tiefs oder fallenden Hochs) = kurzfristiges Momentum.
- Verwendung:
-
- Bullisches Triple-M nahe Unterstützung (HTF-Tief oder NY Mitternachtsöffnung) → möglicher Long-Scalp.
- Bärisches Triple-M nahe Widerstand (HTF-Hoch oder Gann-Niveau) → möglicher Short-Scalp.
- Kann Balken einfärben für schnelle visuelle Erkennung bei schnellen Goldbewegungen.
👉 Funktioniert gut für Sniper-Einstiege auf M1–M5, wenn sie mit HTF-Bias übereinstimmen.
3. Duales ZigZag
- ZigZag #1 (längere Länge) = Swing-Struktur.
- ZigZag #2 (kürzere Länge) = Mikro-Struktur.
- Verwendung:
-
- Identifizieren Sie Marktstrukturbrüche (BOS/CHOCH).
- Handeln Sie nur in Richtung des größeren ZigZag (#1).
- Verwenden Sie den kleineren ZigZag (#2) zur Einstiegskonfirmation.
👉 Beispiel: Täglicher Bias bullisch → warten Sie auf ZigZag #2, der bullisch nahe HTF-Unterstützung wechselt.
4. Gann Unterstützung & Widerstand
- Erzeugt ein Raster von mathematischen S/R-Niveaus.
- Verwendung:
-
- Wenn der Preis konsolidiert, markieren die Niveaus wahrscheinlich Ausbruchspunkte für Expansion.
- Kombinieren Sie mit ATR-Bereichsführer:
-
- „Vorheriger Bereich“ klein → Volatilitätserweiterung erwarten.
- „Nächster Bereich“ hoch → starkes Ausbruchslevel voraus.
👉 Beim Gold stimmen Gann-Niveaus oft mit runden Zahlen überein (z.B. 2400, 2420, 2435).
5. New York Mitternachtsöffnung
- Dies ist eines der mächtigsten ICT-Werkzeuge für Gold.
- Verwendung:
-
- Preis relativ zur NY Mitternachtsöffnung = Richtungs-Bias.
- Wenn der Preis über der Mitternachtsöffnung bleibt → bullische NY-Session.
- Wenn darunter → bärischer Bias.
- Horizontale Linie dient als Gleichgewichts-(50%)-Referenz.
- Achten Sie auf Liquiditäts-Sweeps um dieses Niveau in den London/NY Killzones.
👉 Beispiel:
NY Mitternachtsöffnung = 2405.
- Wenn London den Preis auf 2398 drückt und NY 2405 zurückerobert → starkes Long-Setup.
🔑 Zusammengesetzt (Beispiel-Setup)
- Start der NY-Session:
-
- Zeichnen Sie tägliches OHLC.
- Beachten Sie die NY Mitternachtsöffnung.
- Beobachten Sie nahegelegene Gann-Niveaus.
- Warten Sie auf Liquiditätsaufnahme (Überfall auf Tageshoch/-tief oder Gann S/R).
- Prüfen Sie Triple-M / ZigZag #2 auf mikro bullische/bärische Bestätigung.
- Einstieg mit Stop hinter dem Liquiditäts-Sweep.
- Ziel auf der gegenüberliegenden Seite der Range oder nächstes Gann/HTF-Niveau.
✅ Kurz gesagt:
- Tägliches OHLC + NY Mitternacht = Bias-Filter.
- ZigZag + Triple-M = Einstiegs-Timing.
- Gann + Bereichsführer = Gewinnziele & Expansionssignale.
Dieser Indikator bietet Ihnen im Grunde alle ICT-Style-Werkzeuge in einem Paket für XAU/USD.
Wenn Sie Fragen haben oder auf Probleme stoßen, können Sie mich gerne kontaktieren. Ich helfe Ihnen gerne!
Haftungsausschluss:
Durch die Nutzung meiner Algorithmen erkennen Sie an, dass der Handel mit inhärenten Risiken verbunden ist und vergangene Leistungen keine Garantie für zukünftige Ergebnisse darstellen. Es ist unerlässlich, dass Sie eine solide Risikomanagementstrategie haben und vor allem diszipliniert die Stop-Loss-Level einhalten. Eine mangelhafte Risikoverwaltung kann zu erheblichen Verlusten führen. Ich übernehme keine Verantwortung für finanzielle Ergebnisse, die aus der Nutzung dieser Algorithmen resultieren. Handeln Sie verantwortungsbewusst und befolgen Sie stets bewährte Risikomanagementpraktiken.
Bleiben Sie gesegnet! 🙌
Zusammenfassung
Kundenbewertungen
5 | 100 % | |
4 | 0 % | |
3 | 0 % | |
2 | 0 % | |
1 | 0 % |


