Beschreibung
Der TrendFibonacci Indikator wurde entwickelt, um Händlern dabei zu helfen, kritische Preisniveaus und Markttrends präzise zu identifizieren. Durch die Integration von Fibonacci-Retracement-Leveln mit einem gewichteten gleitenden Durchschnitt (WMA) und dem Average True Range (ATR) bietet dieser Indikator eine klare, visuelle Darstellung von Unterstützung, Widerstand und Trendrichtung.
Hauptmerkmale:
- Dynamische Fibonacci-Level: Berechnet und zeichnet automatisch Fibonacci-Retracement-Level (Standard: 0,382 und 0,618) basierend auf dem höchsten Hoch und dem niedrigsten Tief über einen benutzerdefinierten Rückblickzeitraum.
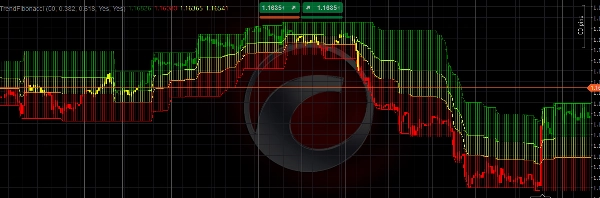
- Gewichteter gleitender Durchschnitt (WMA): Verwendet einen 6-Perioden-WMA zur Einschätzung der Trendrichtung, mit farbcodierten Kerzen (Grün für bullisch, Rot für bärisch, Gelb für neutral), die die Position des WMA relativ zu den Fibonacci-Leveln widerspiegeln.
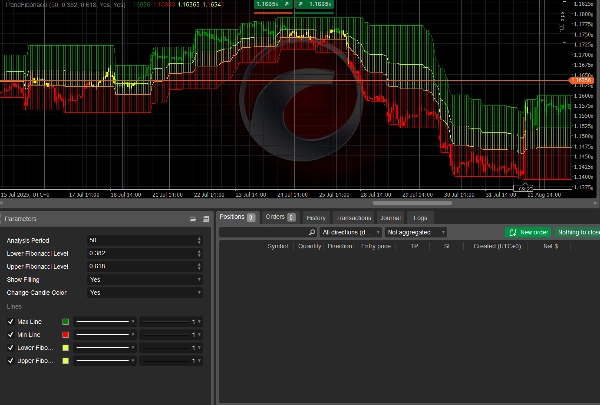
- Anpassbare Parameter: Passen Sie den Analysezeitraum, die Fibonacci-Level an und schalten Sie Funktionen wie gefüllte Zonen und Farbänderungen der Kerzen ein oder aus.
- Visuelle Klarheit: Zeichnet Hoch-/Tief-Linien und füllt Bereiche zwischen Fibonacci-Leveln mit halbtransparenten Farben zur einfachen Trendidentifikation.
- ATR-Integration: Bezieht einen 200-Perioden-ATR für eine robuste Marktanalyse ein und sorgt für Anpassungsfähigkeit an die Volatilität.
Dieser Indikator ist ideal für Händler, die Fibonacci-Analyse mit trendfolgenden Strategien kombinieren möchten. Egal, ob Sie Forex, Aktien oder Rohstoffe handeln, TrendFibonacci verbessert Ihre Fähigkeit, wichtige Umkehrzonen zu erkennen und fundierte Handelsentscheidungen zu treffen.
Anwendung
- Installieren Sie den Indikator:
-
- Fügen Sie den TrendFibonacci Indikator zu Ihrer cTrader-Plattform hinzu, indem Sie den Quellcode hochladen oder ihn aus dem Marktplatz herunterladen.
- Parameter konfigurieren:
-
- Analysezeitraum: Legen Sie den Rückblickzeitraum fest (Standard: 50 Balken), um den Bereich für die Berechnung der Hoch-/Tiefpreise zu bestimmen.
- Unteres Fibonacci-Level: Passen Sie das untere Fibonacci-Retracement-Level an (Standard: 0,382).
- Oberes Fibonacci-Level: Passen Sie das obere Fibonacci-Retracement-Level an (Standard: 0,618).
- Füllung anzeigen: Aktivieren/deaktivieren Sie gefüllte Zonen zwischen den Fibonacci-Leveln (Standard: aktiviert).
- Kerzenfarbe ändern: Aktivieren/deaktivieren Sie farbcodierte Kerzen basierend auf der WMA-Position (Standard: aktiviert).
- Interpretieren Sie den Indikator:
-
- Grüne Kerzen: Deuten auf einen Aufwärtstrend hin, wenn der WMA über dem oberen Fibonacci-Level liegt.
- Rote Kerzen: Signalisieren einen Abwärtstrend, wenn der WMA unter dem unteren Fibonacci-Level liegt.
- Gelbe Kerzen: Deuten auf eine neutrale Zone hin, wenn der WMA zwischen den Fibonacci-Leveln liegt.
- Gefüllte Zonen: Visualisieren wichtige Preiszonen zwischen den Hoch-/Tief-Linien und Fibonacci-Leveln zur Unterstützung-/Widerstandsanalyse.
- Handelsanwendung:
-
- Verwenden Sie den Indikator, um potenzielle Ein- und Ausstiegspunkte an Fibonacci-Leveln zu identifizieren.
- Kombinieren Sie ihn mit anderen technischen Werkzeugen (z. B. RSI, MACD) zur Bestätigung.
- Beobachten Sie farbcodierte Kerzen, um Trendstärke und -richtung zu beurteilen.
- Beste Praktiken:
-
- Testen Sie den Indikator auf einem Demokonto, um sich mit seinem Verhalten vertraut zu machen.
- Passen Sie die Parameter an Ihren Handelsstil und die Marktbedingungen an.
- Verwenden Sie ihn auf höheren Zeitrahmen (z. B. H1, H4) für zuverlässigere Signale.
Der TrendFibonacci Indikator ist ein vielseitiges Werkzeug für Händler aller Erfahrungsstufen und bietet klare, umsetzbare Einblicke in Markttrends und Preisniveaus.
Zusammenfassung
Users can customize parameters such as the analysis period, Fibonacci levels, and visual features like filled zones between Fibonacci levels and candle color changes. The indicator visually highlights support and resistance zones by plotting high/low lines and filling areas between Fibonacci levels with semi-transparent colors. It is applicable across various markets including forex, stocks, commodities, and popular symbols like BTCUSD, EURUSD, GBPUSD, and XAUUSD.
TrendFibonacci supports traders in spotting potential entry and exit points at Fibonacci levels and can be combined with other technical tools like RSI and MACD for confirmation. It is recommended for use on higher timeframes (e.g., H1, H4) to enhance signal reliability.