
Beschreibung
Wir sind umgezogen zu 👉 PrimeQuant
🚫🚫🚫 Kaufen Sie diesen Indikator nicht!
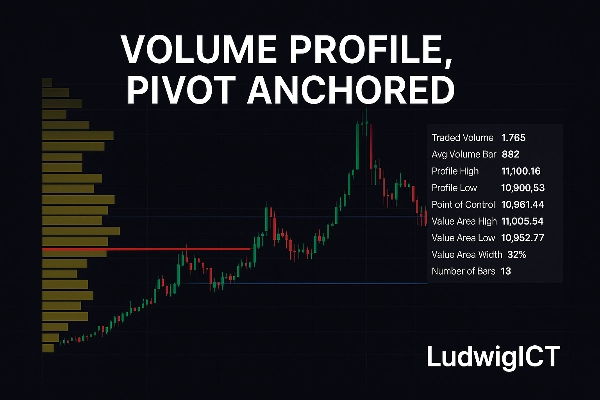
Der Volume Profile, Pivot Anchored Indikator bringt einen professionellen Ansatz zur Marktstruktur- und Volumenanalyse direkt in cTrader. Entwickelt für Trader, die Klarheit, Präzision und umsetzbare Erkenntnisse schätzen, zeigt er, wie die Handelsaktivität innerhalb bedeutender Schwungbereiche über den Preis verteilt ist.
⚡Exklusives Angebot – Begrenzung auf die ersten 10 Käufer!⚡
Entfesseln Sie das volle Potenzial Ihrer Handelsstrategie mit diesem leistungsstarken benutzerdefinierten Indikator, der Ihnen einen präzisen Vorteil am Markt verschafft. Dieses Tool wurde für ernsthafte Trader entwickelt, die klare, umsetzbare Signale und verbesserte Entscheidungsfindung beim Handel von XAU/USD und anderen Forex-Paaren wünschen.
🚀 Warum jetzt kaufen:
Verfügbar zu einem speziellen Einführungspreis – nur für die ersten 10 Trader
Zugang zu fortgeschrittenen Preisaktions-Einblicken
Entwickelt für hohe Genauigkeit und Zuverlässigkeit
Perfekt für Scalping und Swing Trading
Sobald 10 Kopien verkauft sind, wird dieses Angebot nicht mehr zu diesem Preis verfügbar sein. Sichern Sie sich noch heute Ihre Kopie und heben Sie Ihr Trading auf die nächste Stufe!
Was macht es?
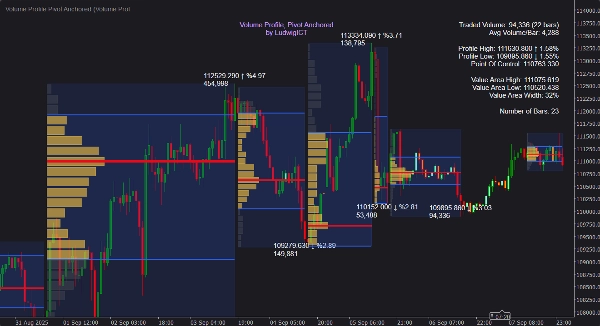
Im Gegensatz zu festen oder sitzungsbasierten Profilen verankert dieses Tool Volumenprofile automatisch an bedeutenden Pivot-Hochs und -Tiefs und bildet so dynamisch den Auktionsprozess jedes Schwungs ab. Dadurch wird sichtbar, wo Marktteilnehmer tatsächlich Kapital eingesetzt haben – nicht nur, wohin sich der Preis bewegt hat.
✨ Wichtige Elemente umfassen:
📍 Automatische Pivot-Erkennung – Profile werden zwischen Schwunghochs und -tiefs erstellt und aktualisieren sich, wenn neue Pivots entstehen.
📊 Detaillierte Volumenverteilung – Histogramme zeigen, wie das Volumen über den Preis verteilt ist, mit benutzerdefinierter Auflösung und Breite.
🎯 Value Area & POC Levels – Sofortige Berechnung und Visualisierung von Point of Control (POC), Value Area High (VAH) und Value Area Low (VAL).
📈 Entwickelndes Profil – Ein live-aktualisiertes Profil des aktuellen Schwungs bietet zukunftsorientierten Kontext.
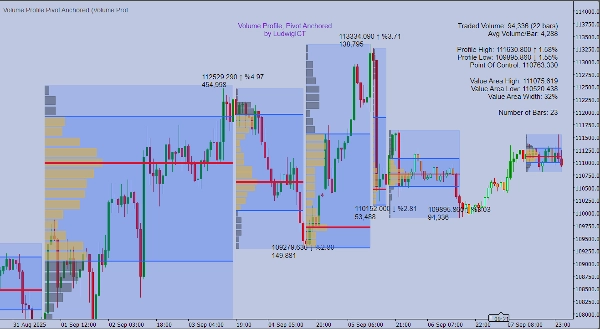
➡️ Erweiterung der POC-Zonen – Projizieren Sie den POC nach vorne, bis er vom Preis berührt oder überschritten wird, um zukünftige Reaktionszonen hervorzuheben.
📝 Informationsreiche Labels & Tooltips – Preislabels, % Änderung, kumulatives Volumen und ein übersichtliches Statistikpanel beim Überfahren.
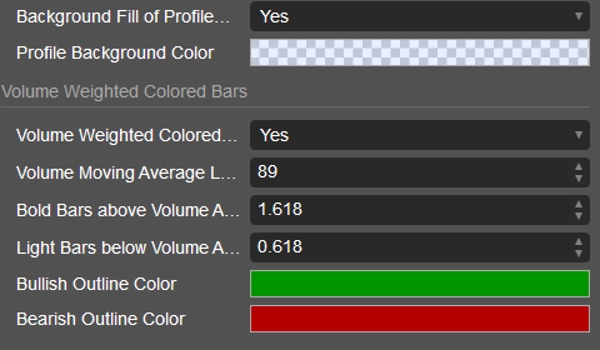
🎨 Volumen-gewichtete Kerzenfärbung – Kerzen werden nach Volumenintensität schattiert für schnelle Mustererkennung.
⚙️ Volle Anpassung – Passen Sie Farben, Platzierung und Anzeige an, um sich nahtlos in Ihren Chart-Stil einzufügen.
Wie man es benutzt
1️⃣ An jeden Chart anhängen – funktioniert über alle Zeitrahmen und Instrumente hinweg.
2️⃣ Pivot-Länge anpassen – steuert die Empfindlichkeit gegenüber Schwunghochs/-tiefs (kürzer = mehr Profile, länger = nur Hauptstruktur).
3️⃣ Profile im Kontext interpretieren:
• 🎯 POC – Preisniveau mit dem meisten gehandelten Volumen, oft ein Magnet.
• 📏 VAH / VAL – Grenzen des Wertbereichs, starke Unterstützung/Widerstand.
• 🌀 Histogrammform – Identifizieren von Gleichgewichtsbereichen, Ablehnungszonen und Verteilungsschwankungen.
4️⃣ Beobachten Sie das sich entwickelnde Profil – verfolgen Sie, wie sich die Auktionsstruktur in Echtzeit aufbaut.
5️⃣ Verwenden Sie Alarme – lassen Sie sich benachrichtigen, wenn der Preis mit POC, VAH, VAL interagiert oder wenn Volumenstarke Kerzen erscheinen.
6️⃣ Als Rahmenwerk anwenden – verfeinern Sie Einstiege auf volumenbasierten Ebenen, antizipieren Sie Umkehrungen und bestätigen Sie Trends durch Volumenstruktur.
Warum Trader es verwenden
Dieser Indikator übersetzt rohes Volumen in bedeutungsvolle Struktur. Durch die Verankerung der Profile an Pivots passt er sich den dynamischen Marktbedingungen an, anstatt sich auf willkürliche Sitzungsaufteilungen zu stützen. Ob Intraday-, Swing- oder Positionshandel, die verankerte Volumenverteilung bietet tiefere Klarheit für Entscheidungen.
Wichtige Parameter auf einen Blick
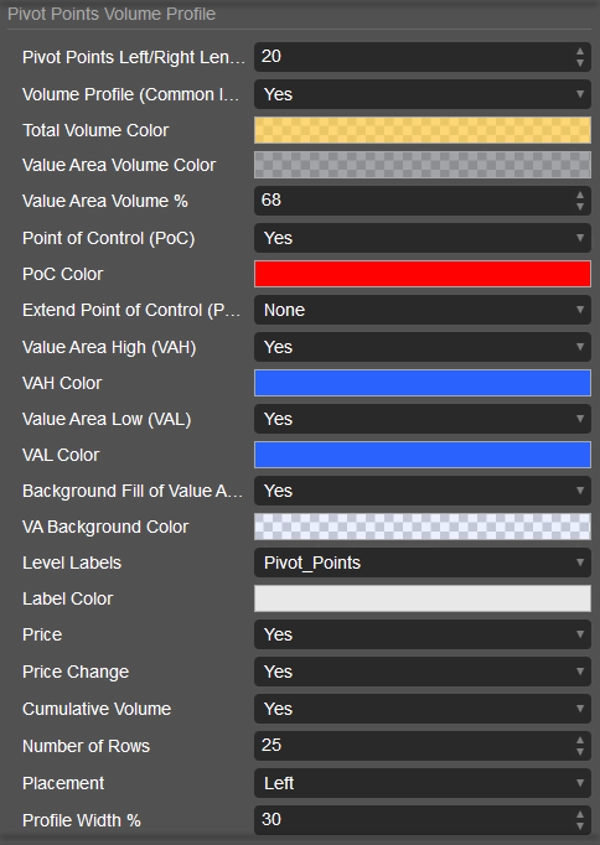
⚙️ Pivot-Empfindlichkeit – definiert, wie aggressiv Schwungpunkte erkannt werden.
📊 Profilebenen & Breite – steuert Profilauflösung und Sichtbarkeit.
🎯 POC-Erweiterungsmodi – Keine, bis zur letzten Kerze, bis Berührung oder bis Überschreitung.
📏 Wertbereich % – vollständig anpassbar (Standard 68%).
🎨 Volumenfärbung – Schwellenwerte zur Hervorhebung starker/schwacher Teilnahme.
Volume Profile, Pivot Anchored von LudwigICT ist keine generische Visualisierung – es ist eine strukturelle Linse, wie Märkte wirklich auktionieren. Für Trader, die professionelle Werkzeuge verlangen, bietet es einen entscheidenden Vorteil beim Lesen des Zusammenspiels von Preis und Volumen.
Wenn Sie Fragen haben oder auf Probleme stoßen, können Sie mich gerne kontaktieren. Ich helfe Ihnen gerne!
Haftungsausschluss:
Durch die Nutzung meiner Algorithmen erkennen Sie an, dass der Handel mit inhärenten Risiken verbunden ist und vergangene Leistungen keine Garantie für zukünftige Ergebnisse darstellen. Es ist unerlässlich, dass Sie eine solide Risikomanagementstrategie haben und vor allem diszipliniert die Stop-Loss-Niveaus einhalten. Eine mangelhafte Risikosteuerung kann zu erheblichen Verlusten führen. Ich übernehme keine Verantwortung für finanzielle Ergebnisse, die aus der Nutzung dieser Algorithmen resultieren. Handeln Sie verantwortungsbewusst und befolgen Sie stets bewährte Risikomanagementpraktiken.
Alles Gute! 🙌
Zusammenfassung
Kundenbewertungen
5 | 67 % | |
4 | 33 % | |
3 | 0 % | |
2 | 0 % | |
1 | 0 % |


