Açıklama
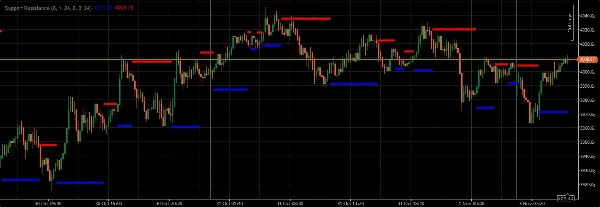
Altın ticareti yaparken, potansiyel pivot kırılmalarını veya destek/direnç noktalarını belirlemek için çeşitli zaman dilimlerindeki (büyük, aralık ve tik grafikler) destek ve direnç seviyelerini kullanın. Daha yüksek olasılıklı işlemler için bu sinyalleri her zaman hareketli ortalamalar, osilatörler ve mum çubuğu formasyonları gibi diğer teknik göstergelerle teyit edin
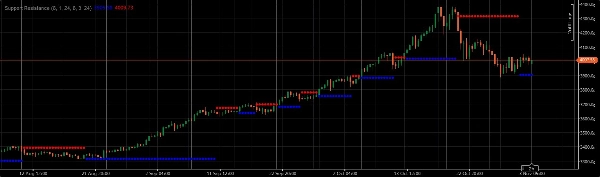
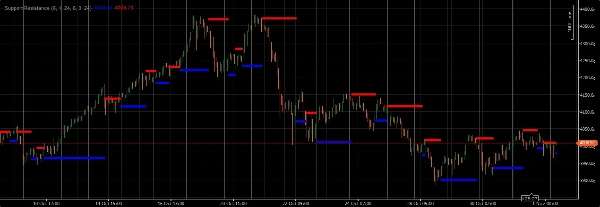
Altın ticareti yaparken, potansiyel pivot kırılmalarını veya destek/direnç noktalarını belirlemek için çeşitli zaman dilimlerindeki (büyük, aralık ve tik grafikler) destek ve direnç seviyelerini kullanın. Altın ticareti yaparken, potansiyel pivot kırılmalarını veya destek/direnç noktalarını belirlemek için çeşitli zaman dilimlerindeki (büyük, aralık ve tik grafikler) destek ve direnç seviyelerini kullanın. Bu seviyeler belirlendikten sonra, kritik karar noktaları olarak hizmet edebilir. Direncin üzerinde veya desteğin altında bir kırılma, özellikle artan gövde mumuyla birlikte olduğunda, genellikle trendin devamını veya piyasa duyarlılığında önemli bir değişikliği işaret eder. Tersine, bir destek seviyesinden sıçrama veya dirençte reddedilme, potansiyel bir dönüşü veya mevcut konsolidasyonun devamını gösterebilir. Daha yüksek olasılıklı işlemler için bu sinyalleri her zaman hareketli ortalamalar, osilatörler ve mum çubuğu formasyonları gibi diğer teknik göstergelerle teyit edin. Ayrıca, haber olaylarına ve ekonomik veri açıklamalarına yakından dikkat edin, çünkü bunlar altın fiyatlarını dramatik şekilde etkileyebilir ve sadece teknik kurulumları geçersiz kılabilir. Risk yönetimi çok önemlidir; herhangi bir işlemde ticaret sermayenizin küçük bir yüzdesinden fazlasını asla riske atmayın.
Özet
Müşteri değerlendirmeleri
5 | 100 % | |
4 | 0 % | |
3 | 0 % | |
2 | 0 % | |
1 | 0 % |


!["[Stellar Strategies] Smart ADX" logosu](https://cdn.ctrader.com/image/webp/af13b084-b6f6-41db-b7bc-c7e688b57b05_36929)


