
KeyLevels
Indikator
328 downloads
Version 1.0, Nov 2025
Windows, Mac
Seit 24/04/2025
168.09M
Gehandeltes Volumen
17.73K
Pip-Gewinn
11
Verkäufe
328
Kostenlose Installationen
Beschreibung
Überblick
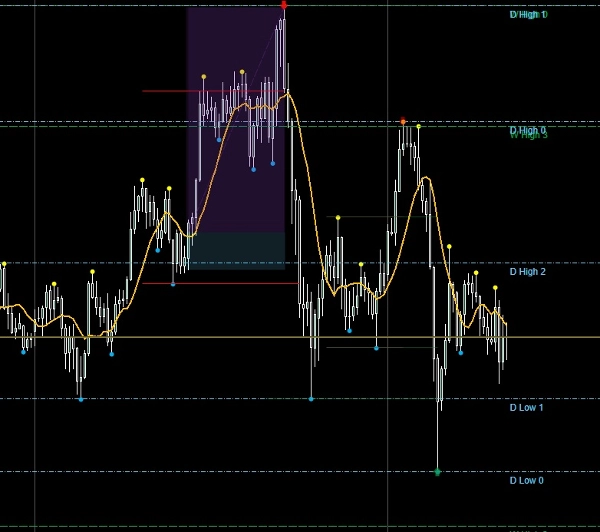
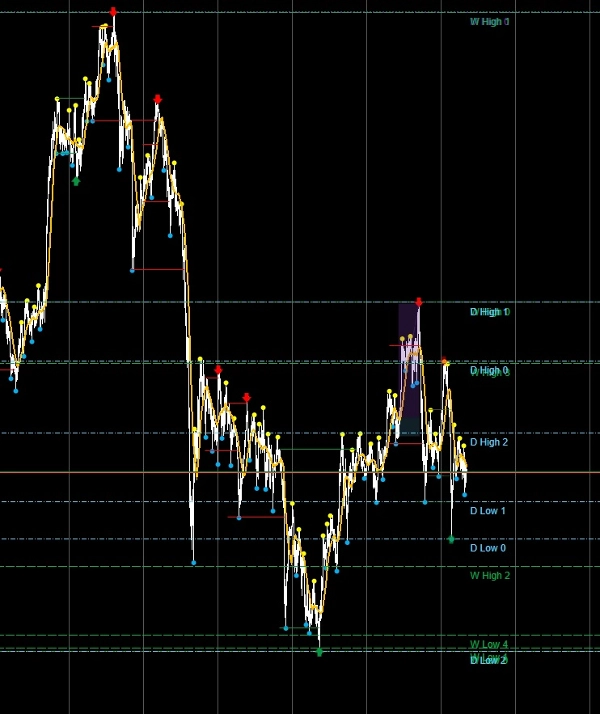
Der Key Levels Indicator ist für Trader entwickelt, die sich auf höherzeitliche Ankerpunkte verlassen, um die Intraday-Ausführung zu steuern. Er identifiziert und zeichnet automatisch horizontale Linien für monatliche, wöchentliche und tägliche Hochs und Tiefs, sodass Sie sofortige strukturelle Übersicht über mehrere Zeitrahmen erhalten. Jede Ebene ist vollständig anpassbar, sodass Sie die Darstellung an Ihr Playbook und Ihren Arbeitsablauf anpassen können.
Hauptmerkmale
- 🔹 Multi‑Timeframe Levels – Zeichnet Hochs und Tiefs von monatlichen, wöchentlichen und täglichen Balken.
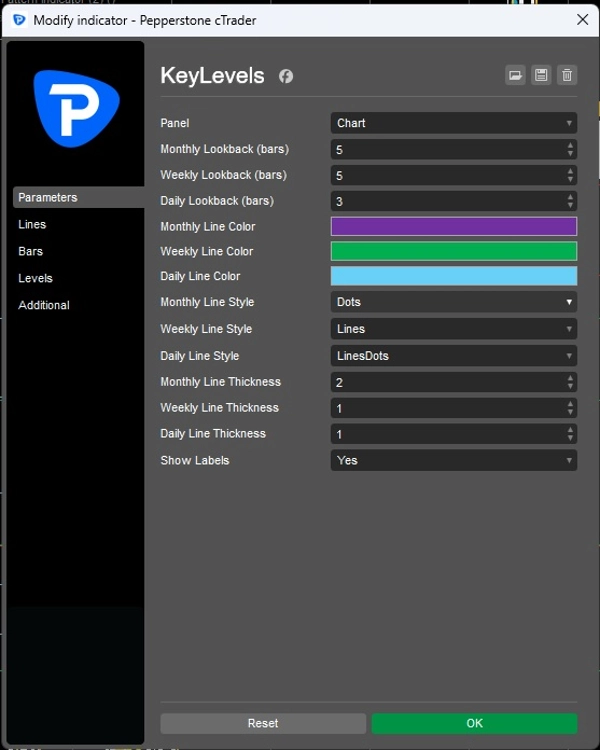
- 🔹 Benutzerdefinierte Rückblickperioden – Wählen Sie, wie viele vergangene Balken für jeden Zeitrahmen berücksichtigt werden sollen.
- 🔹 Visuelle Anpassung – Legen Sie individuelle Farben, Linienarten und Dicke für monatliche, wöchentliche und tägliche Ebenen fest.
- 🔹 Beschriftungsoption – Schalten Sie Beschriftungen ein/aus für eine klare Identifikation jeder Ebene.
- 🔹 Dynamische Aktualisierungen – Ebenen werden automatisch aktualisiert, sobald neue Balken schließen.
- 🔹 Saubere Chart-Integration – Linien werden direkt in Ihrem Chart zur einfachen Referenz gezeichnet.
Vorteile für Trader
- Verankert Ihre Intraday-Setups an objektiven höherzeitlichen Ebenen.
- Stärkt Disziplin- und Überzeugungsfilter, indem nur wichtige strukturelle Punkte angezeigt werden.
- Spart Zeit durch automatisches Zeichnen der Ebenen – kein manuelles Zeichnen mehr.
- Verbessert die Klarheit bei der Kombination mehrerer Zeitrahmenanalysen.
Anwendungsfälle
- Intraday-Scalper können Einstiege mit täglichen oder wöchentlichen Ebenen abstimmen.
- Swing-Trader können monatliche Anker für Fortsetzungs-Setups verfolgen.
- Playbook-gesteuerte Trader können den Indikator in ihre einheitliche Checkliste für sofortige Klassifizierung integrieren.
Zusammenfassung
Indikatorprofil
Kundenbewertungen
0.0
Bewertungen: 0
Kundenbewertungen
Bisher gibt es keine Bewertungen für dieses Produkt. Haben Sie es schon ausprobiert? Dann können Sie die erste Person sein, die andere darüber informiert!
Diskussion
Häufig gestellte Fragen (FAQ)
BTCUSD
Forex
Signal
Breakout
Indices
EURUSD
Commodities
GBPUSD
NZDUSD
Prop
Scalping
Crypto
Stocks
XAUUSD
NAS100
USDJPY
Über den cTrader Store verfügbare Produkte, einschließlich Handelsbots, Indikatoren und Plugins, werden von externen Entwicklern bereitgestellt und nur zu Informations- und technischen Zugriffszwecken verfügbar gemacht. cTrader Store ist kein Broker und erbringt keine Anlageberatung, persönlichen Empfehlungen oder eine Garantie für zukünftige Performance.
Mehr von diesem Autor


Preis
Seit 24/04/2025
168.09M
Gehandeltes Volumen
17.73K
Pip-Gewinn
11
Verkäufe
328
Kostenlose Installationen