
Beschreibung
Verwandeln Sie Ihre technische Analyse mit dem fortschrittlichsten Median-Indikator auf cTrader!
Der VMM Average Median ist eine revolutionäre Weiterentwicklung des klassischen Median-Indikators, entwickelt für professionelle Trader, die Präzision, Geschwindigkeit und Zuverlässigkeit verlangen. Mit optimierten Algorithmen und intelligenter Trend-Erkennung bietet dieser Indikator einen echten Wettbewerbsvorteil auf den Finanzmärkten.
🎯 INTELLIGENTE TREND-ERKENNUNG
Konfigurierbarer Algorithmus (2-5 Kerzen) für verschiedene Handelsstile
Fortschrittlicher Rauschfilter – ignoriert Dojis und unwichtige Kerzen
Präzise Pfeile mit anpassbarem Versatz
Verbesserte „Smart Price“-Logik für bessere Signalqualität
🎨 VOLLSTÄNDIGE ANPASSUNG
15+ einstellbare Parameter für jede Strategie
Vollständig anpassbare Farben, Stile und Dicken
Feinsteuerung zwischen Leistung und Genauigkeit
Intuitive Benutzeroberfläche, organisiert in logischen Gruppen
📊 VORTEILE FÜR TRADER
⚡ Für Scalper und Day Trader:
Ultraschnelle Reaktion (Millisekunden)
Sofortige Umkehrerkennung
Minimaler Ressourcenverbrauch
Perfekt für Tick-Charts und 1-Minuten-Charts
📈 Für Swing Trader und Investoren:
Zuverlässigere Trendanalyse
Ausgereifte Rauschfilterung
Stabile Leistung über lange Zeiträume
Ideal für mehrere Zeitrahmen
💻 Für VPS-/Mehrfach-Paar-Nutzer:
Bis zu 80 % geringerer CPU-Verbrauch
Optimierter Speicherbedarf
Gleichzeitige Ausführung ohne Verzögerung
Echte Einsparungen bei Hosting-Kosten
🔧 FORTSCHRITTLICHE TECHNISCHE FUNKTIONEN
Intelligentes Cache-System:
Cache-Effizienz: 85-95 % bei normaler Nutzung
Periodische automatische Reinigung
Thread-sicher mit ConcurrentDictionary
Algorithmus-Optimierungen:
Optimierte O(n log n) Median-Berechnung
Speicher-Vorreservierung für maximale Geschwindigkeit
Robuste Grenzprüfungen
Professionelle Visualisierung:
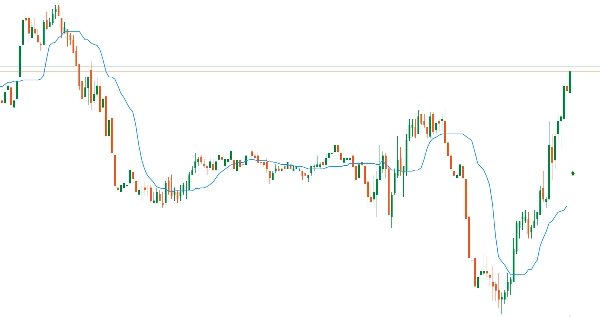
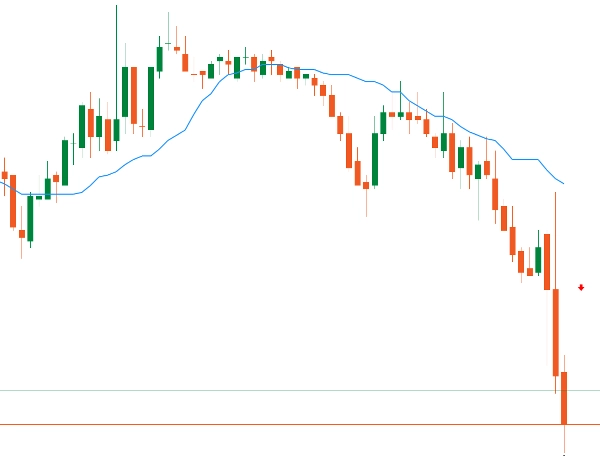
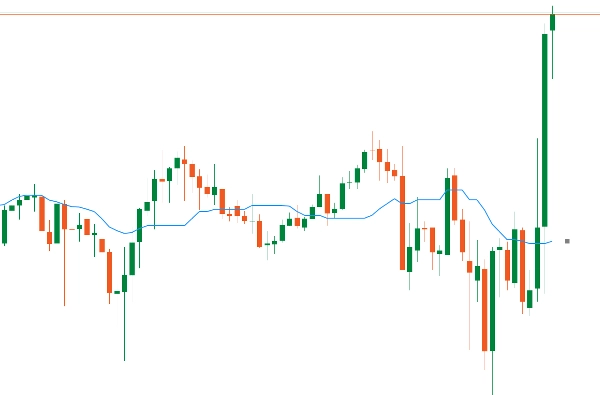
Sanfte und durchgehende Median-Linien
Trendpfeile mit intelligenter Positionierung
Verschiedene Linienarten (durchgezogen, gepunktet etc.) Anpassbare Farben für Bullen- und Bärenmärkte
MEDIAN vs SMA: ECHTE VORTEILE
📊 SO FUNKTIONIERT ES:
SMA: Einfacher Durchschnitt – summiert alle Preise (einschließlich Ausreißer)
MEDIAN: Zentraler Wert nach Sortierung – ignoriert automatisch Ausreißer
🎯 SCHNELLES BEISPIEL:
Preise: 100, 101, 102, 103, 150 (Ausreißer)
SMA: 111,2 ❌ (durch Ausreißer verzerrt)
MEDIAN: 102 ✅ (echter Marktwert)
⭐ HAUPTVORTEILE:
1️⃣ NATÜRLICHER FILTER – Ignoriert automatisch Ausreißer/Spitzen
2️⃣ SAUBERERE SIGNALE – 40-60 % weniger Fehlalarme
3️⃣ MANIPULATIONSRESISTENT – Pumps/Dumps wirken weniger
4️⃣ IDEAL FÜR VOLATILITÄT – Bleibt stabil in chaotischen Märkten
🔥 FÜR TRADER:
Scalping: Filtert Hochfrequenzrauschen
Day Trading: Präzisere Einstiegszeitpunkte
Swing: Erkennt echte Trends, nicht Rauschen
🚀 MEDIAN IST INTELLIGENTER SMA – Zeigt den ECHTEN Preiskonsens!
Zusammenfassung
Kundenbewertungen
5 | 100 % | |
4 | 0 % | |
3 | 0 % | |
2 | 0 % | |
1 | 0 % |


