

Beschreibung
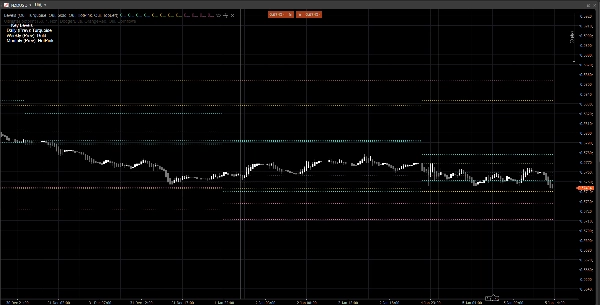
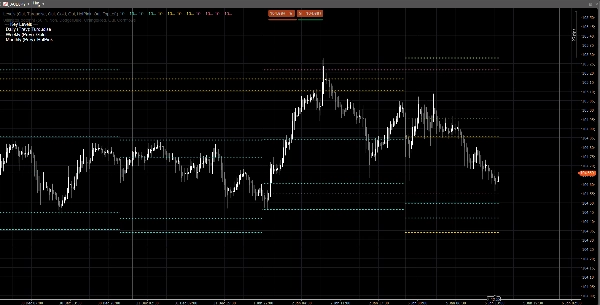
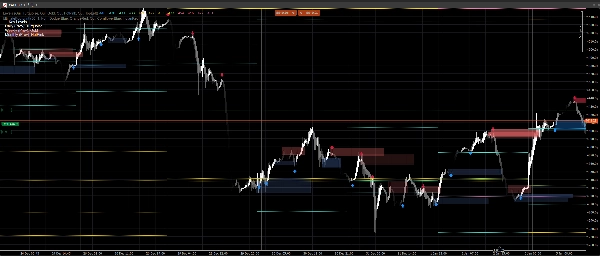
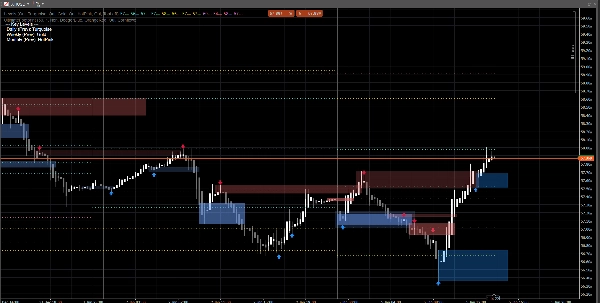
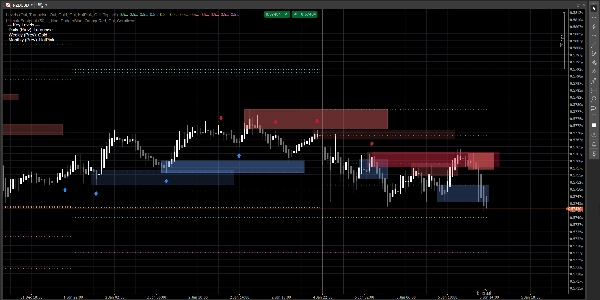
Price Action Zones ist ein leichtgewichtiger, rauschfreier Indikator, der die vorherigen täglichen, wöchentlichen und monatlichen Schlüsselbereiche direkt in Ihrem Chart darstellt.
Er zeigt an:
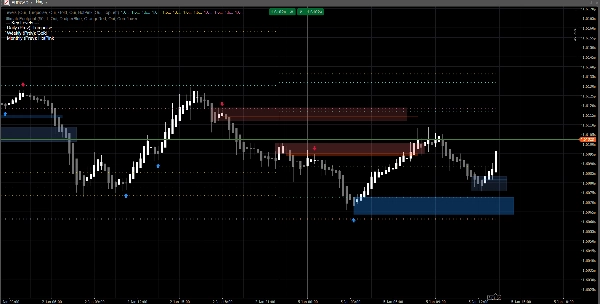
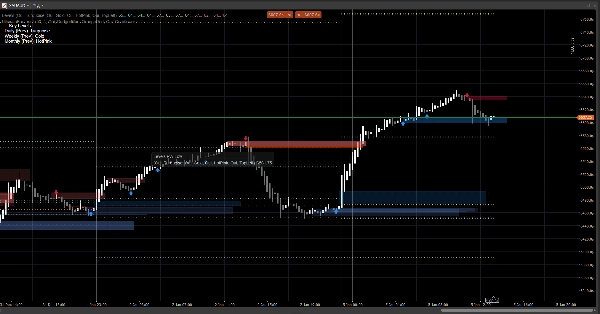
- Vorheriger Tag: Hoch / Tief / Eröffnung / Schluss
- Vorherige Woche: Hoch / Tief / Eröffnung / Schluss
- Vorheriger Monat: Hoch / Tief / Eröffnung / Schluss
Diese Niveaus werden häufig als Reaktionszonen, Liquiditätsreferenzen und Kontextanker für Marktstruktur, Einstiege, Ziele und Risikoplatzierung verwendet.
Warum es nützlich ist
- Sofortige Anzeige von Referenzniveaus höherer Zeitrahmen ohne Chartwechsel
- Hilft Ihnen, die Intraday-Preisbewegung um PDH/PDL, PWH/PWL, PMH/PML zu strukturieren
- Saubere Visualisierung: Niveaus bleiben für die aktuelle Sitzung/Woche/Monat konstant
- Funktioniert bei jedem Symbol und Zeitrahmen
Anpassung
Sie können jeden Zeitrahmen unabhängig ein- oder ausschalten:
- Tägliche / Wöchentliche / Monatliche Anzeige
- Legen Sie eine benutzerdefinierte Farbe für jede Gruppe fest
- Aktivieren Sie eine einfache Legende mit wählbarer Eckpositionierung
Technische Hinweise
- Die Niveaus werden anhand der vorherigen abgeschlossenen Tages-/Wochen-/Monatskerze berechnet (nicht der aktuell entstehenden).
- Dies verhindert Neuzeichnungen und hält die Niveaus während der Sitzung stabil.
Haftungsausschluss
Dieser Indikator dient nur zur Chartdarstellung und Entscheidungsunterstützung. Er generiert keine Kauf-/Verkaufssignale und stellt keine Finanzberatung dar. Verwalten Sie stets Ihr Risiko und validieren Sie anhand eigener Daten.
Die Signale im Chart werden vom Indikator Ultimate Footprint erzeugt, der in meinem Profil verfügbar ist.


