
Beschreibung
WAS ES TUT
Auto-Draw Fibonacci Suite erkennt automatisch Swing-Strukturen und zeichnet sieben geometrische Werkzeuge gleichzeitig—vier Fibonacci-Werkzeuge plus drei ergänzende geometrische Analysewerkzeuge—ohne manuelle Platzierung.
Traditionelle Fibonacci-Analyse bedeutet, Swings zu identifizieren, Retracements zu zeichnen, Fans von denselben Swings neu zu zeichnen, Pitchforks manuell zu platzieren, Zeitzonen anzupassen. Jedes Werkzeug erfordert eine separate Einrichtung. Jeder neue Swing bedeutet, alles neu zu zeichnen.
Dieser Indikator automatisiert den gesamten Prozess.
Swings werden einmal durch die Regressionsmethode erkannt. Alle sieben geometrischen Werkzeuge—Fibonacci-Retracement, Expansion, Fan und Zeitzonen sowie Andrews Pitchfork, äquidistanter Kanal und Gann-Fan—beziehen sich automatisch auf dieselben Swing-Punkte.
Wenn der Preis einen neuen Swing bildet, aktualisiert jedes aktive Werkzeug in Echtzeit. Kein Neuzeichnen. Keine manuelle Swing-Auswahl. Keine geometrische Inkonsistenz durch die Verwendung unterschiedlicher Pivot-Punkte in den Werkzeugen.
DER HAUPTVORTEIL
Manueller Ansatz:
- Visuelle Identifikation von Swing-Hoch und Swing-Tief
- Fibonacci-Retracement zeichnen
- Dieselben Swings erneut identifizieren, Fan zeichnen
- Drei Swings finden, Pitchfork manuell platzieren
- Preis bildet neuen Swing → gesamten Prozess wiederholen
Auto-Draw-Ansatz:
- Indikator erkennt Swings automatisch
- Alle sieben Werkzeuge zeichnen und aktualisieren sich selbst
- Preis bildet neuen Swing → alles aktualisiert sich automatisch
- Der Unterschied ist strukturell. Statt sieben separater manueller Arbeitsabläufe haben Sie ein automatisiertes Erkennungssystem, das sich über alle geometrischen Bereiche erstreckt—Fibonacci-basierte Werkzeuge für die Verhältnis-Analyse und drei zusätzliche geometrische Rahmenwerke für eine umfassende Marktstrukturabbildung.
DIE WERKZEUGSUITE
Vier Fibonacci-Werkzeuge:
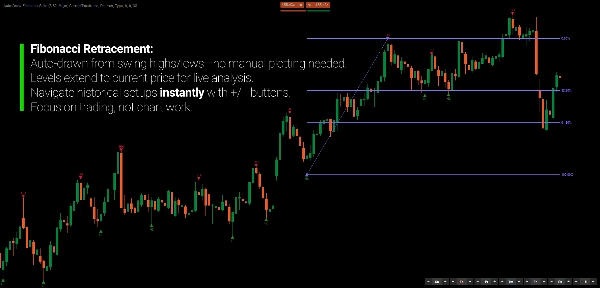
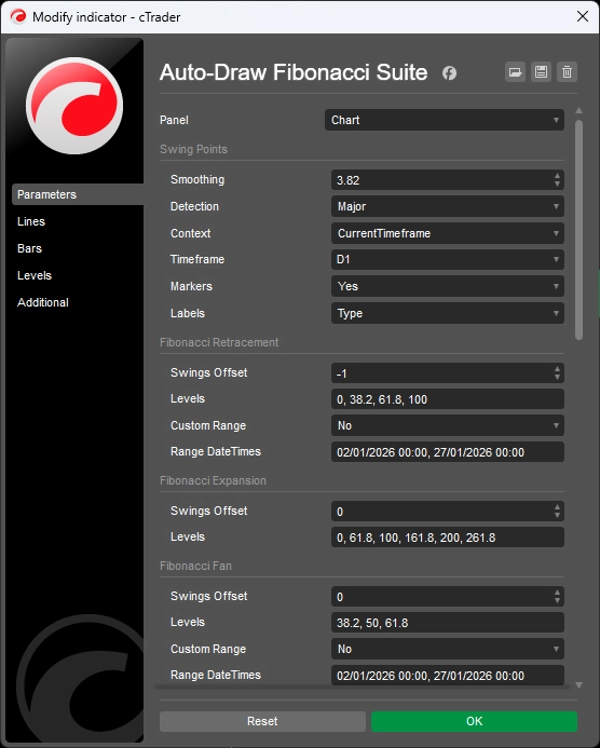
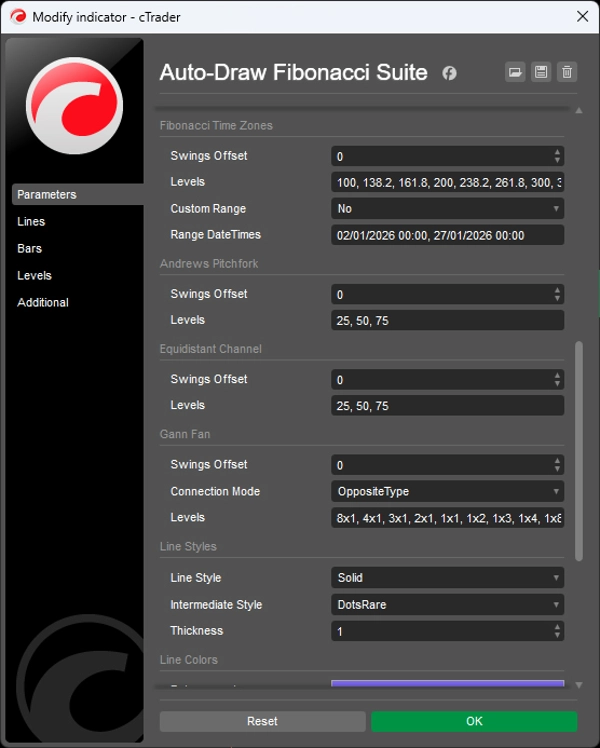
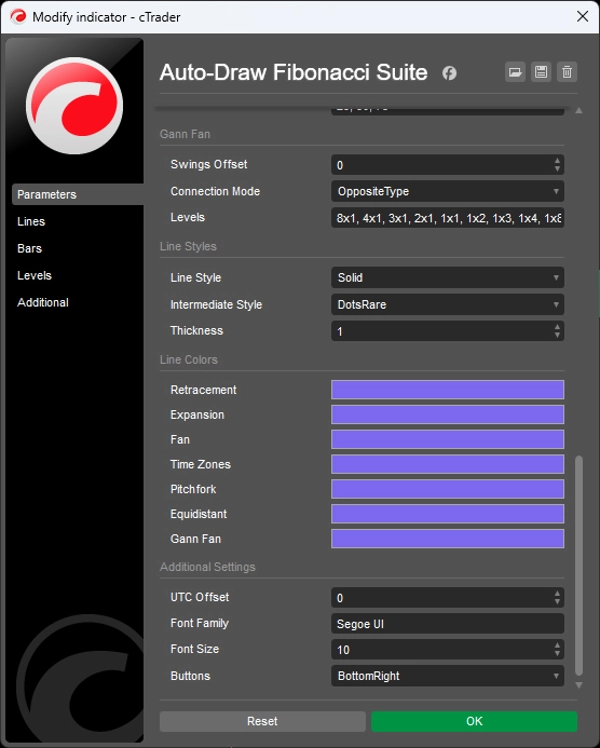
- Fibonacci-Retracement — horizontale Niveaus (0%, 38,2%, 61,8%, 100%)
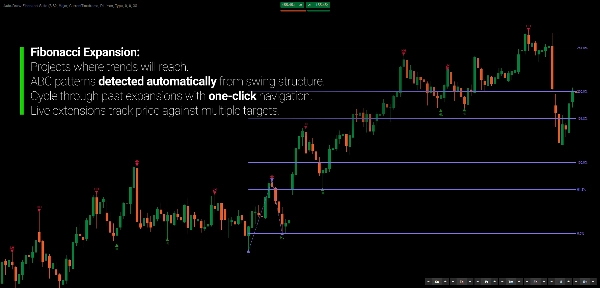
- Fibonacci-Expansion — Projektion von Zielen über den dritten Swing hinaus
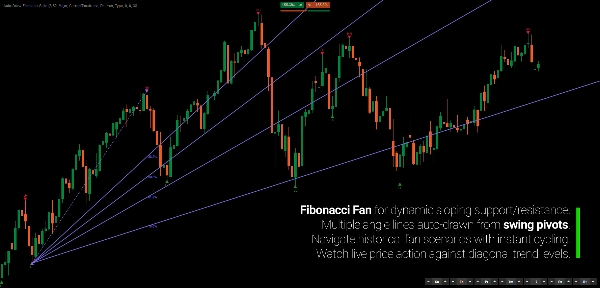
- Fibonacci-Fan — diagonale Trendlinien von Pivot-Punkten
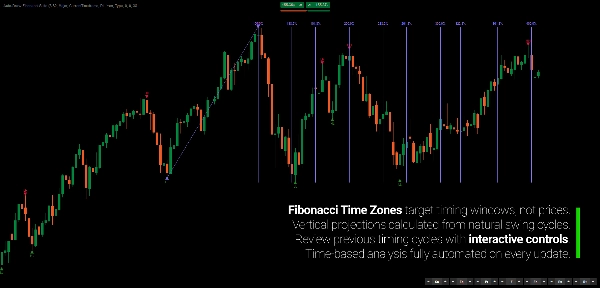
- Fibonacci-Zeitzonen — vertikale Zeitprojektion
Drei ergänzende geometrische Werkzeuge:
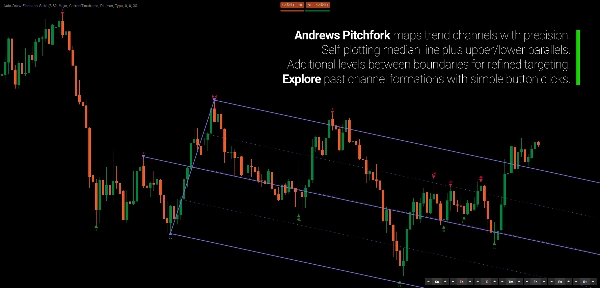
- Andrews Pitchfork — dreipunktige Medianlinie mit parallelen Kanälen
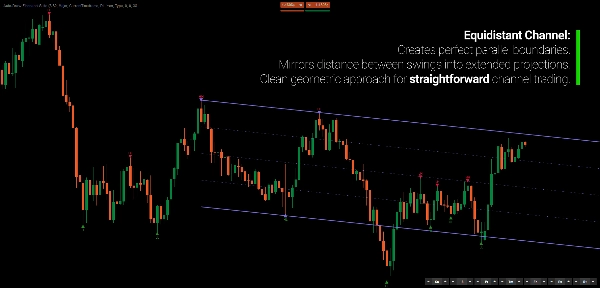
- Äquidistanter Kanal — paralleler Kanal mit Zwischenebenen
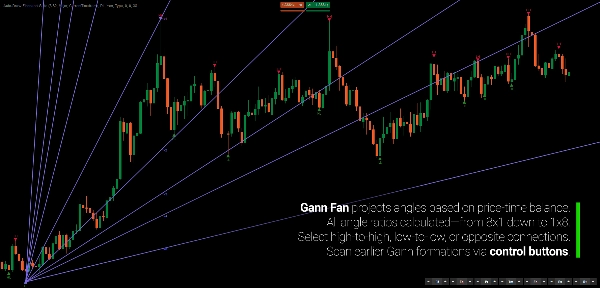
- Gann-Fan — Preis-zu-Zeit-Winkelprojektionen (8x1, 4x1, 2x1, 1x1, 1x2…)
Jedes Werkzeug kann unabhängig aktiviert werden. Alle beziehen sich auf dieselbe zugrunde liegende Swing-Erkennung.
VEREINHEITLICHTE SWING-ERKENNUNG
Drei Erkennungsmodi steuern die Swing-Empfindlichkeit:
- Major — weniger, stärkere Swings (bestätigt durch Schlusskurse)
- Standard — ausgewogene Granularität (am häufigsten)
- Minor — erkennt innere Swings innerhalb von Trends (maximale Details)
Swings werden automatisch klassifiziert (HH/LL/LH/HL) und nach Tiefe, Volumen und Dauer gemessen. Visuelle Marker zeigen bestätigte Swings (Dreiecke), unbestätigte Swings (Kreise) und innere Swings (Quadrate).
INTERAKTIVE OFFSET-STEUERUNGEN
Sieben Schaltflächengruppen (je eine pro Werkzeug) ermöglichen es Ihnen, sofort anzupassen, welche historischen Swings jede geometrische Projektion verwendet:
- 0 — neueste Swing-Struktur
- -1 — vorherige Struktur
- -2 — zwei Strukturen zurück
Gehen Sie rückwärts durch die Swing-Historie, um zu sehen, wie sich geometrische Beziehungen an früheren Strukturpunkten entwickelt haben. Ändern Sie die Referenz-Swings eines Werkzeugs, ohne die anderen zu beeinflussen.
MEHRZEITRAHMEN-UNTERSTÜTZUNG
Wenden Sie die Swing-Erkennung auf einen höheren Zeitrahmen an, während Sie ein Chart mit niedrigerem Zeitrahmen betrachten. Sehen Sie Daily-Swings und alle geometrischen Projektionen auf Ihrem H1-Chart—kein Zeitrahmenwechsel erforderlich.
HAUPTMERKMALE
- Automatische Swing-Erkennung durch Regressionsmethode
- Sieben geometrische Werkzeuge, die automatisch aus einheitlichen Swing-Referenzen gezeichnet werden
- Echtzeit-Updates bei neuen Swings
- Interaktive Offset-Steuerungen für jedes Werkzeug
- Mehrzeitrahmen-Modus (Daily analysieren, H1 handeln)
- Drei Erkennungsmodi (Major/Standard/Minor)
- Swing-Klassifikation (HH/LL/LH/HL) und Metriken
- Intelligente Swing-Gruppierung (eliminiert redundante Zwischen-Swings)
- Vollständig anpassbare Levels, Farben, Stile
- Hervorgehobene Quell-Swings für aktive Werkzeuge
FÜR WEN ES GEEIGNET IST
Dieser Indikator ist für Trader, die Fibonacci- und geometrische Analysewerkzeuge verstehen, aber keine Zeit mit manueller Platzierung und Neuzeichnung verbringen möchten.
Wenn Sie mehrere Fibonacci-Projektionen verwenden und ständig neu zeichnen, während sich der Preis entwickelt—oder bestimmte Werkzeuge vermeiden, weil die manuelle Platzierung zu mühsam ist—automatisiert diese Suite diesen Arbeitsablauf.
Sie ist gut geeignet für Swing- und Positions-Trader, die geometrische Referenzen über mehrere Werkzeuge benötigen, Multi-Timeframe-Analysten, die Struktur aus höheren Zeitrahmen auf Ausführungs-Charts sehen wollen, und diskretionäre Trader, die geometrische Konfluenz schätzen, aber nicht den Aufwand der manuellen Werkzeugverwaltung.
Dies ist kein Signalsystem. Es ist ein Automatisierungswerkzeug für Trader, die bereits in Fibonacci- und geometrischen Begriffen denken und wollen, dass sich ihre Analyse selbst aktualisiert.
WAS ES UNTERSCHEIDET
Die meisten geometrischen Analyseindikatoren zeichnen nur einen Werkzeugtyp. Diese Suite zeichnet sieben gleichzeitig aus einheitlicher Swing-Erkennung.
Die meisten erfordern manuelle Swing-Auswahl. Diese automatisiert die Swing-Identifikation und aktualisiert alle Werkzeuge in Echtzeit.
Die meisten behandeln jedes Werkzeug unabhängig. Diese bewahrt geometrische Kohärenz, indem sichergestellt wird, dass alle Projektionen dieselben zugrunde liegenden Strukturen referenzieren.
Das Ergebnis: vollständige Multi-Framework-geometrische Analyse ohne ständiges Neuzeichnen.
---
FIBONACCI ALS GEOMETRISCHE SPRACHE VERSTEHEN
Fibonacci-Analyse wird oft missverstanden als vorhersagend—als ob Märkte bestimmte Verhältnisse "respektieren". Das verfehlt das grundlegende Prinzip.
Fibonacci-Verhältnisse sagen nicht voraus, wohin der Preis gehen wird. Sie bieten ein standardisiertes geometrisches Vokabular, um zu beschreiben, wie sich der Preis in Bezug auf vorherige Strukturen bewegt. Ein Retracement auf 61,8 % stellt eine geometrische Beziehung zwischen der aktuellen Korrektur und dem vorherigen Impuls dar—nicht "Unterstützung" im kausalen Sinn.
Der Wert liegt in der geometrischen Kohärenz, nicht in einzelnen Niveaus. Wenn mehrere Projektionen zusammenlaufen—Retracement-Level, das mit Fan-Winkel und Zeitzone übereinstimmt—spiegelt diese Konvergenz strukturelle Konsistenz über verschiedene Messbereiche wider.
Märkte zielen nicht auf Fibonacci-Niveaus ab. Wenn geometrische Projektionen übereinstimmen, zeigt diese Übereinstimmung die zugrunde liegende strukturelle Ordnung. Deshalb haben isolierte Niveaus einen begrenzten Wert, während konvergente geometrische Strukturen oft Wendepunkte markieren.
Die Geometrie ist nicht die Ursache. Sie ist die beschreibende Sprache struktureller Beziehungen.
---
Trading beinhaltet Risiken. Dieser Indikator ist ein Werkzeug der technischen Analyse—verwenden Sie stets ein angemessenes Risikomanagement.


![„[Stellar Strategies] Market Session Ultimate“-Logo](https://cdn.ctrader.com/image/webp/61ffd537-0125-4246-9e72-42eca1791d64_28232)
