
คำอธิบาย
ตัวบ่งชี้โซนดอนเชียนขั้นสูงสำหรับ cTrader
ควบคุมแนวโน้มตลาด & การเบรกเอาต์อย่างแม่นยำ!
ยกระดับการเทรดของคุณด้วย ตัวบ่งชี้โซนดอนเชียนขั้นสูง – เครื่องมือทรงพลังที่ออกแบบมาสำหรับเทรดเดอร์ที่ต้องการความแม่นยำ ความยืดหยุ่น และประสิทธิภาพ ตัวบ่งชี้รุ่นถัดไปนี้ช่วยเพิ่มช่องดอนเชียนคลาสสิกด้วยการแนะนำ การวิเคราะห์หลายกรอบเวลา, การคำนวณราคาที่ปรับแต่งได้, การแจ้งเตือนแบบเรียลไทม์ และ การแสดงผลแบบคลาวด์.
ไม่ว่าคุณจะเทรด ฟอเร็กซ์ หุ้น หรือสินค้าโภคภัณฑ์ ตัวบ่งชี้โซนดอนเชียนขั้นสูงจะมอบเครื่องมือให้คุณระบุการเบรกเอาต์ ขี่ตามแนวโน้ม และเทรดการกลับตัวเหมือนมืออาชีพ
คุณสมบัติหลัก & ประโยชน์:
1. โซนดอนเชียนหลายกรอบเวลา
- วิเคราะห์โซนดอนเชียนจาก กรอบเวลาที่สูงกว่า ขณะเทรดในกรอบเวลาที่ต่ำกว่า เพื่อให้คุณสอดคล้องกับแนวโน้มตลาดใหญ่เสมอ
- เหมาะสำหรับ เทรดเดอร์รายวันและเทรดเดอร์สวิง ที่ต้องการเพิ่มประสิทธิภาพการเข้าและออก
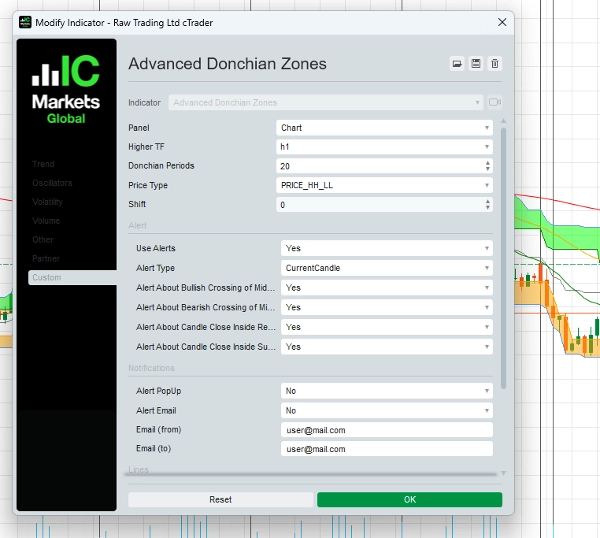
2. การคำนวณราคาที่ปรับแต่งได้
- เลือกจาก ประเภทราคาขั้นสูงห้าประเภท เพื่อปรับแต่งกลยุทธ์ของคุณ:
-
- สูงสุดสูง / ต่ำสุดต่ำ
- ค่าเฉลี่ยของสูง/เปิด หรือ สูง/ปิด
- เปิดสูงสุด / เปิดต่ำสุด
- ปิดสูงสุด / ปิดต่ำสุด
- ปรับตัวบ่งชี้ให้เหมาะกับสไตล์การเทรดและการจัดการความเสี่ยงของคุณ
3. การแจ้งเตือนแบบไดนามิก – ไม่พลาดโอกาส!
- รับ การแจ้งเตือนแบบเรียลไทม์ เมื่อเกิดเหตุการณ์สำคัญในการเทรด:
-
- การตัดผ่านเส้นกลาง (สัญญาณกระทิงหรือหมี)
- ราคาปิดภายในโซนสำคัญ (โซนที่อาจเกิดการกลับตัวหรือเบรกเอาต์)
- การแจ้งเตือนผ่าน ป๊อปอัปและอีเมล ช่วยให้คุณนำหน้าการเคลื่อนไหวของตลาด
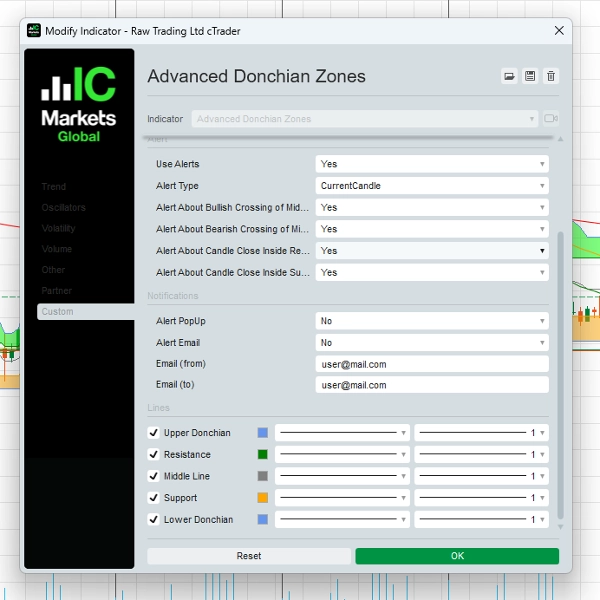
4. การแสดงผลแบบคลาวด์เพื่อข้อมูลเชิงลึกที่ชัดเจน
- โซนที่ มีเงาเฉพาะตัว ระหว่างระดับดอนเชียนช่วยให้เทรดเดอร์ระบุ แนวรับ แนวต้าน และโซนเบรกเอาต์ ได้อย่างรวดเร็วและมีประสิทธิภาพ
5. พารามิเตอร์การเลื่อนที่ยืดหยุ่น
- ปรับตำแหน่งของโซนดอนเชียน ไปข้างหน้า หรือถอยหลัง ตามเวลาเพื่อปรับแต่งกลยุทธ์การเทรดของคุณ
6. อินเทอร์เฟซใช้งานง่าย
- ออกแบบมาสำหรับ เทรดเดอร์ทุกระดับ ด้วยเลย์เอาต์ที่เข้าใจง่ายและการตั้งค่าที่ปรับแต่งได้ตามความชอบของคุณ
วิธีใช้ตัวบ่งชี้โซนดอนเชียนขั้นสูง
1. กลยุทธ์การเทรดเบรกเอาต์ – จับการเคลื่อนไหวที่รุนแรง!
- การตั้งค่า:
-
- ใช้ตัวบ่งชี้โซนดอนเชียนขั้นสูงกับกราฟของคุณ
- เลือก ช่วงเวลาดอนเชียน (เช่น 20) และ กรอบเวลาที่สูงกว่า (เช่น 1H หรือ 4H) เพื่อสัญญาณที่แม่นยำขึ้น
- การเข้าเทรด:
-
- ซื้อ (Go Long) เมื่อราคาทะลุและปิด เหนือโซนดอนเชียนบนสุด.
- ขาย (Go Short) เมื่อราคาทะลุและปิด ต่ำกว่าโซนดอนเชียนล่างสุด.
- การออก:
-
- ใช้ เส้นกลาง หรือโซนดอนเชียนตรงข้ามเป็นระดับออก
- ตัวอย่าง:
-
- ถ้าเทรดกราฟ 15 นาที ตั้งค่าการคำนวณดอนเชียนตาม กรอบเวลา 1 ชั่วโมง เมื่อราคาทะลุเหนือระดับดอนเชียนบนสุด ให้เข้าเทรดซื้อพร้อมตั้งจุดหยุดขาดทุนใกล้เส้นกลาง
2. กลยุทธ์ตามแนวโน้ม – ขี่แรงโมเมนตัมตลาด
- การตั้งค่า:
-
- ใช้ เส้นกลาง เป็นตัวกรองแนวโน้ม
- เทรดเฉพาะในทิศทางของแนวโน้มหลัก
- การเข้าเทรด:
-
- ซื้อ (Go Long) เมื่อราคาสูงกว่า เส้นกลาง และเด้งจาก โซนแนวรับ.
- ขาย (Go Short) เมื่อราคาต่ำกว่า เส้นกลาง และเด้งจาก โซนแนวต้าน.
- การออก:
-
- ปิดการเทรดเมื่อราคาตัดผ่านเส้นกลางในทิศทางตรงกันข้าม
- ตัวอย่าง:
-
- บนกราฟ 4 ชั่วโมง ราคายังคงอยู่ เหนือเส้นกลาง ยืนยันแนวโน้มขาขึ้น เข้าเทรดซื้อเมื่อราคาย่อตัวไปยังโซนแนวรับและแสดงสัญญาณกลับตัว
3. กลยุทธ์การเทรดในช่วงแนวรับแนวต้าน – ทำกำไรในตลาดไซด์เวย์
- การตั้งค่า:
-
- ระบุช่วงเวลาที่ราคาผันผวนระหว่าง โซนดอนเชียนบนและล่าง.
- การเข้าเทรด:
-
- ซื้อ (Go Long) เมื่อราคาเข้าใกล้ แนวรับ.
- ขาย (Go Short) เมื่อราคาเข้าใกล้ แนวต้าน.
- การออก:
-
- ทำกำไรใกล้โซนดอนเชียนตรงข้ามหรือเมื่อเกิดการเบรกเอาต์
- ตัวอย่าง:
-
- บนกราฟ 1 ชั่วโมง หากราคาผันผวนระหว่าง ระดับดอนเชียนบนและล่าง ให้ทำการเทรดที่จุดสูงสุดและต่ำสุดเหล่านี้เพื่อโอกาสกลับตัว
ทำไมเทรดเดอร์จึงเลือกใช้โซนดอนเชียนขั้นสูง
✔ เหมาะกับสไตล์การเทรดที่หลากหลาย – ใช้ได้กับเบรกเอาต์ การตามแนวโน้ม และการเทรดในช่วงแนวรับแนวต้าน
✔ เพิ่มความแม่นยำในการเทรด – ระบุระดับแนวรับ & แนวต้านสำคัญได้อย่างแม่นยำ
✔ การแจ้งเตือนแบบเรียลไทม์ – รับข้อมูลทันทีด้วยการแจ้งเตือนทันใจ
✔ เครื่องมือระดับมืออาชีพ – พัฒนาสำหรับเทรดเดอร์ที่ต้องการความได้เปรียบในตลาด
ราคา & ข้อเสนอพิเศษ
ราคาพิเศษจำกัดเวลา: $97 (ชำระครั้งเดียว)
รวม:
- ตัวบ่งชี้โซนดอนเชียนขั้นสูงสำหรับ cTrader
- คู่มือผู้ใช้ครบถ้วน พร้อมกลยุทธ์ทีละขั้นตอน
- อัปเดตฟรี เป็นเวลา 1 ปี
- การสนับสนุนทางอีเมลลำดับความสำคัญ
เสียงจากเทรดเดอร์
“ผมใช้ช่องดอนเชียนมาหลายปีแล้ว แต่ตัวบ่งชี้นี้ยกระดับขึ้นไปอีก ฟีเจอร์หลายกรอบเวลาเปลี่ยนเกมเลย!”
— Mark S., เทรดเดอร์ฟอเร็กซ์
“การแจ้งเตือนและการตั้งค่าราคาที่ปรับแต่งได้ช่วยให้ผมจับการเทรดเบรกเอาต์ได้มั่นใจขึ้น แนะนำสำหรับเทรดเดอร์จริงจัง”
— Lisa T., เทรดเดอร์สวิง
เริ่มต้นวันนี้เลย!
พร้อมเปลี่ยนแปลงการเทรดของคุณหรือยัง? คลิกปุ่มด้านล่างเพื่อซื้อ ตัวบ่งชี้โซนดอนเชียนขั้นสูง และเริ่มเทรดอย่างแม่นยำ!
[ซื้อเลยในราคา $97]
รับประกันคืนเงิน 30 วัน
เรายืนหยัดในผลิตภัณฑ์ของเรา หากคุณไม่พอใจอย่างสมบูรณ์ ติดต่อเราภายใน 30 วัน เพื่อรับ เงินคืนเต็มจำนวน – ไม่มีคำถามใดๆ
ต้องการความช่วยเหลือ? ติดต่อเรา!
📧 อีเมล: o.elmottaqy@gmail.com
🌐 เว็บไซต์: https://t.me/mottaqyo
ข้อจำกัดความเสี่ยง
การเทรดมีความเสี่ยง ตัวบ่งชี้ โซนดอนเชียนขั้นสูง เป็นเครื่องมือช่วยในการตัดสินใจเทรดของคุณ แต่ไม่รับประกันผลกำไร โปรดใช้การจัดการความเสี่ยงอย่างเหมาะสมและเทรดอย่างรับผิดชอบ
สรุป
Key functionalities include real-time alerts via pop-ups and email for significant events such as midline crossovers and price closing inside key zones, helping traders stay informed of potential breakouts or reversals. A unique cloud visualization feature shades zones between Donchian levels to clearly identify support, resistance, and breakout areas. The flexible shift parameter allows users to adjust the positioning of Donchian Zones forward or backward in time for strategy fine-tuning.
Suitable for forex, stocks, and commodities markets, this indicator supports multiple trading strategies including breakout, trend-following, and range-bound trading. It features an intuitive interface designed for traders of all levels. The product includes a comprehensive user guide with step-by-step strategies, free updates for one year, and priority email support.
รีวิวจากลูกค้า
5 | 50 % | |
4 | 50 % | |
3 | 0 % | |
2 | 0 % | |
1 | 0 % |


