Beschreibung
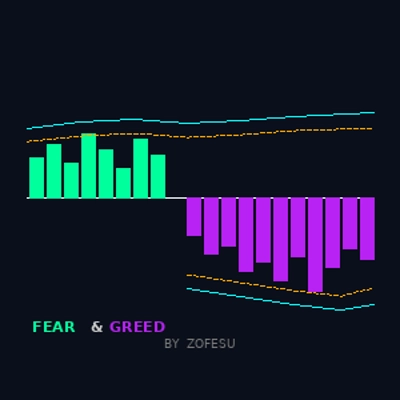
📊 Fear & Greed von Zofesu — Dualer VIX-Motor | Institutionelle Sentiment-Erkennung
Fear & Greed ist ein Präzisionsoszillator, der auf einem dualen Williams VIX Fix-Motor basiert — einer kalibriert für Panik (Fear), einer für Euphorie (Greed). Er identifiziert Momente, in denen institutionelle Überhitzung statistisch extreme Werte erreicht, und signalisiert Zonen mit hoher Wahrscheinlichkeit für Umkehrungen.
⚙ WIE ES FUNKTIONIERT
Der Indikator führt zwei unabhängige WVF-Berechnungen durch:
Fear-Motor — misst, wie weit das aktuelle Tief vom höchsten jüngsten Schlusskurs entfernt ist. Spitzen signalisieren Kapitulation und Panik.
Greed-Motor — misst, wie weit das aktuelle Hoch vom niedrigsten jüngsten Tief entfernt ist. Spitzen signalisieren euphorische Überdehnung.
Jeder Motor wird durch zwei unabhängige Schwellenwerte gefiltert:
1. Bollinger-Band obere/untere Grenze (2× StdAbw)
2. Perzentil-Rang-Schwelle (konfigurierbar)
Ein Histogrammbalken erscheint NUR, wenn der Preis BEIDE oder EINE der Schwellen überschreitet — wodurch Rauschen eliminiert und nur statistisch signifikante Extreme angezeigt werden.
🔑HAUPTMERKMALE
✅ Dualer WVF-Motor — Fear (Limette) und Greed (Lila) werden unabhängig mit separaten Rückblickfenstern berechnet
✅ BB-Bänder — dynamische Bollinger-Band-Grenzen für jeden Motor
✅ Perzentillinien — konfigurierbare Perzentil-Rang-Schwellen
✅ Saubere Histogrammausgabe — Balken nur bei extremen Werten sichtbar
✅ Alle 4 Grenzlinien sind unabhängig ein-/ausschaltbar
✅ Vollständig konfigurierbar — separater Rückblick und Perzentil für Fear und Greed
✅ Funktioniert auf allen Assets und Zeitrahmen
✅ Leichtgewichtiges C# — keine Leistungseinbußen
📚ANWENDUNG
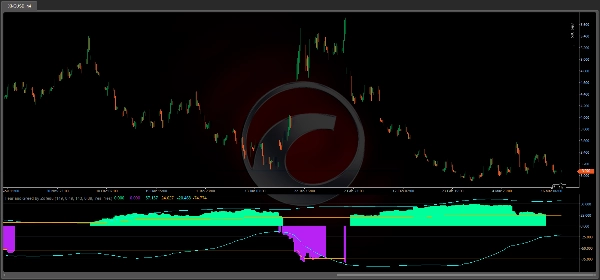
1. Fügen Sie den Indikator als separates Panel zu einem beliebigen Chart hinzu
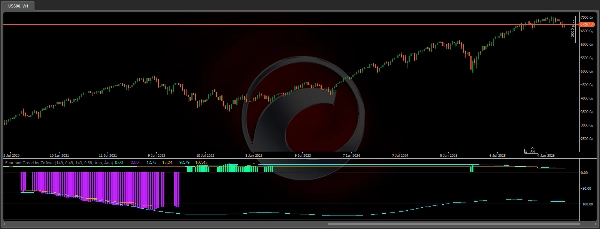
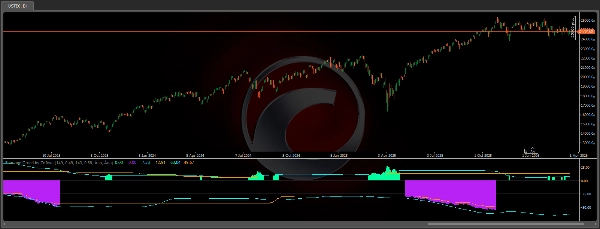
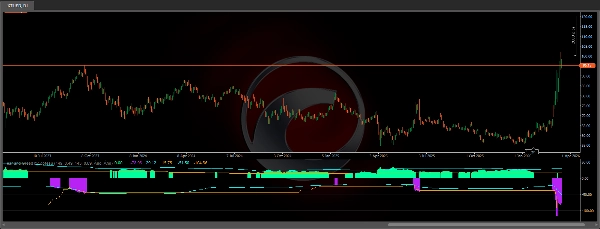
2. Limettenfarbener Histogramm = Fear-Spitze — potenzielle bullische Umkehrzone
3. Lila Histogramm = Greed-Spitze — potenzielle bärische Umkehrzone
4. Aqua-Linien = BB-Grenzen für jeden Motor
5. Orange gestrichelte Linien = Perzentil-Schwellen
6. Verwenden Sie ihn in Kombination mit Preisaktion, S/R-Niveaus, SuperTrend oder VWAP
7. Höhere Zeitrahmen (D1, W1) liefern die zuverlässigsten Signale Beste Ergebnisse auf: H1, H4, D1 Funktioniert auf: Indizes (NAS100, SPX500), Krypto (BTCUSD), Forex, Gold, Öl, Aktien.
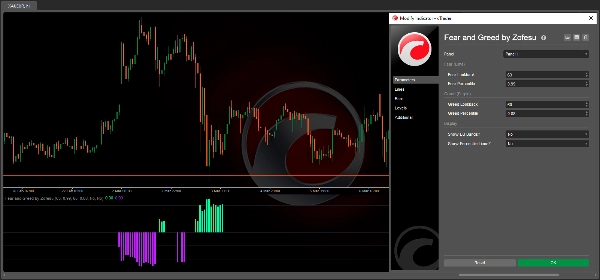
🔗PARAMETER
Fear (Limette):
- Fear Lookback — Balken für WVF- und BB-Berechnung (Standard 149)
- Fear Perzentil — Perzentil-Rang-Schwelle (Standard 0,49)
Greed (Lila):
- Greed Lookback — Balken für WVF- und BB-Berechnung (Standard 143)
- Greed Perzentil — Perzentil-Rang-Schwelle (Standard 0,89)
Anzeige:
- BB-Bänder anzeigen — Aqua-Grenzlinien ein-/ausschalten
- Perzentillinien anzeigen — orange Schwellenlinien ein-/ausschalten
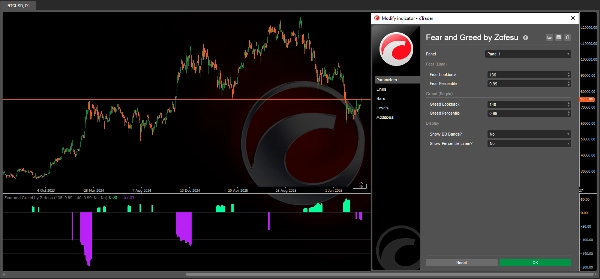
🎯 KALIBRIERUNGSANLEITUNG (AUS ERFAHRUNG)
Jedes Asset und jeder Zeitrahmen benötigt eigene, einzigartige Einstellungen — der Indikator ist so konzipiert, dass diese Flexibilität möglich ist.
Schritt 1 — Finden Sie den richtigen Lookback:
Stellen Sie zunächst das Perzentil auf 0,99 ein und experimentieren Sie dann mit dem Lookback-Wert zwischen 10 und 1000.
Ein höherer Lookback reduziert Rauschen, kann aber auch gültige Signale verbergen. Der empfohlene Bereich liegt für die meisten Setups bei 50–500.
Schritt 2 — Feinabstimmung des Perzentils:
Sobald Sie einen passenden Lookback gefunden haben, reduzieren Sie das Perzentil schrittweise von 0,99 nach unten. Dies lockert den Filter und zeigt zusätzliche Signale. Die Parameter für Fear und Greed müssen nicht übereinstimmen.
Schritt 3 — Signalinterpretation:
- Fear-Balken verschwindet bei geschlossenem Kerzenkörper → potenzieller Long-Einstieg bei der nächsten Kerze.
- Greed-Balken verschwindet bei geschlossenem Kerzenkörper → potenzieller Short-Einstieg bei der nächsten Kerze.
- Fear oder Greed leuchten über mehrere Balken hinweg = Markt befindet sich in einem Trend oder akkumuliert Positionen — nicht unbedingt eine Umkehr.
- Sowohl Fear als auch Greed leuchten gleichzeitig = widersprüchlicher Druck. Prüfen Sie zuerst den höheren Zeitrahmen. Gibt es ein wichtiges S/R-Niveau in der Nähe? Falls ja, warten Sie auf eine Bestätigung, bevor Sie einsteigen.
Die Anzahl der Signale hängt ganz von Ihnen und Ihrer Strategie ab — strengere Einstellungen liefern weniger, aber qualitativ hochwertigere Einstiege. Nach der richtigen Einstellung können Sie die Linien in den Einstellungen ausschalten, damit sie nicht stören.
⚠️ HAFTUNGSAUSSCHLUSS Der Handel mit Finanzinstrumenten birgt ein erhebliches Verlustrisiko. Die vergangene Performance eines Indikators oder einer Strategie garantiert keine zukünftigen Ergebnisse. Dieses Tool wird nur zu Informations- und Bildungszwecken bereitgestellt. Verwenden Sie stets ein angemessenes Risikomanagement und riskieren Sie niemals mehr, als Sie sich leisten können zu verlieren. Der Autor übernimmt keine Verantwortung für Handelsverluste, die durch die Nutzung dieses Indikators entstehen.
Zusammenfassung
Kundenbewertungen
5 | 0 % | |
4 | 100 % | |
3 | 0 % | |
2 | 0 % | |
1 | 0 % |


