

Fisher Oscillator
지표
버전 1.0, May 2026
Windows, Mac
가입일 21/02/2025
466.3M
거래량
180.83K
핍 수익
26
판매
7.44K
무료 설치
설명
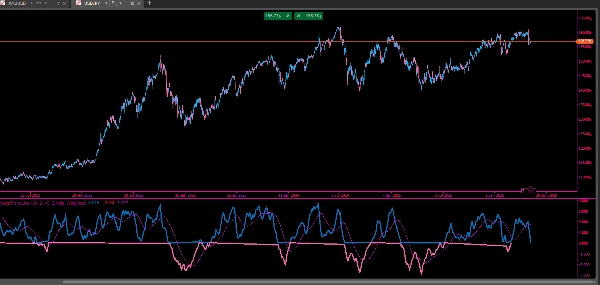
이 지표는 cTrader용으로 설계된 수정된 Fisher 변환 버전입니다. 가격 데이터를 정규화된 오실레이터로 변환하여 시장의 잠재적 전환점을 강조합니다.
구성 가능한 기간 동안 중간 가격(고가와 저가의 평균)을 기반으로 부드럽게 처리된 Fisher 변환을 계산합니다. 이 변환은 극단적인 가격 움직임을 강조하여 고점과 저점을 더 쉽게 식별할 수 있게 합니다.
노이즈를 줄이기 위해 원시 Fisher 값은 구성 가능한 기간과 유형의 두 이동 평균을 사용하여 추가로 부드럽게 처리됩니다. 이 지표는 또한 양수 및 음수 Fisher 값을 두 가지 다른 색상(녹색과 빨간색)으로 구분하여 0선 주변의 시각적 명확성을 향상시킵니다.
또한 두 번째 이동 평균을 사용하여 신호선(노란색)이 표시되어 트레이더가 추세 방향과 모멘텀 변화를 더 명확하게 식별할 수 있도록 도와줍니다.
전반적으로 이 지표는 반전 감지, 과매수/과매도 상태 강조, 그리고 계층적 평균화를 통한 더 부드러운 추세 확인에 사용됩니다.
요약
AI summary
The Fisher Oscillator is a modified version of the Fisher Transform indicator designed for the cTrader platform. It converts price data into a normalized oscillator that highlights potential market turning points by emphasizing extreme price movements. The calculation is based on a smoothed Fisher Transform of the midpoint price (average of high and low) over a configurable period.
To reduce noise, the indicator applies two moving averages with customizable periods and types to smooth the raw Fisher values. It visually separates positive and negative Fisher values into green and red plots, respectively, enhancing clarity around the zero line. Additionally, a yellow signal line derived from the second moving average helps identify trend direction and momentum shifts.
This indicator is primarily used to detect market reversals, highlight overbought and oversold conditions, and provide smoother trend confirmation through layered averaging. It supports trend and market structure analysis and outputs visual signals suitable for bar-based price data.
To reduce noise, the indicator applies two moving averages with customizable periods and types to smooth the raw Fisher values. It visually separates positive and negative Fisher values into green and red plots, respectively, enhancing clarity around the zero line. Additionally, a yellow signal line derived from the second moving average helps identify trend direction and momentum shifts.
This indicator is primarily used to detect market reversals, highlight overbought and oversold conditions, and provide smoother trend confirmation through layered averaging. It supports trend and market structure analysis and outputs visual signals suitable for bar-based price data.
지표 프로필
지표 카테고리
추세
출력 유형
시각화
데이터 요구 사항
막대만
지원되는 신호
추세 강도
반전
고객 리뷰
0.0
리뷰: 0
고객 리뷰
이 상품에 대한 리뷰가 아직 없습니다. 이미 사용해 보셨나요? 다른 사람들에게 가장 먼저 소개해 주세요!
상담
자주 묻는 질문(FAQ)
EMA
Market Structure
Moving Average
트레이딩 봇, 지표, 플러그인 등 cTrader Store에서 제공되는 상품은 제3자 개발자에 의해 제공되며, 이는 단순히 정보 및 기술적 접근을 목적으로 제공된 것입니다. cTrader Store는 중개인이 아니며, 투자 조언, 개인별 추천 또는 향후 성과에 대한 어떠한 보장도 제공하지 않습니다.





























가격
가입일 21/02/2025
466.3M
거래량
180.83K
핍 수익
26
판매
7.44K
무료 설치