
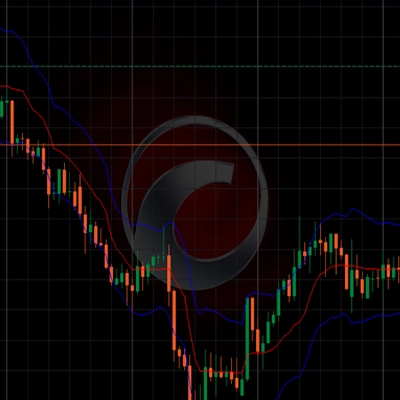
KAMAKeltner
Indicador
Versión 1.0, May 2025
Windows, Mac
4.3
Valoraciones: 3

Desde 02/02/2025
1
Ventas
Descripción
KAMA Keltner combina el poder del Promedio Móvil Adaptativo de Kaufman (KAMA) con la dinámica comprobada de los Canales Keltner, creando una banda de volatilidad receptiva y autoajustable que se adapta a las condiciones del mercado en tiempo real.
A diferencia de los canales tradicionales, esta versión reacciona más rápido a los cambios de tendencia mientras filtra el ruido, gracias a su motor de suavizado adaptativo. Ideal para:
- Estrategias de reversión a la media – define con precisión las zonas de sobrecompra/sobreventa
- Sistemas de ruptura – se adapta dinámicamente a las expansiones de volatilidad
- Entradas y salidas siguiendo la tendencia – señales claras en entornos de rango y tendencia
Diseñado para traders que exigen precisión, adaptabilidad y rapidez – ya sea que hagas scalping, swing trading o ejecutes modelos algorítmicos.
Resumen
Resumen de IA
KAMA Keltner is a technical indicator that integrates Kaufman's Adaptive Moving Average (KAMA) with Keltner Channels to form a responsive, self-adjusting volatility band. This adaptive channel adjusts dynamically to real-time market conditions, providing faster reaction to trend changes while filtering out market noise through its smoothing engine. It is designed to support various trading strategies, including mean reversion by identifying overbought and oversold zones, breakout systems by adapting to volatility expansions, and trend-following entries and exits with clear signals in both ranging and trending markets. The indicator is suitable for traders employing scalping, swing trading, or algorithmic models who require accuracy, adaptability, and speed in their analysis.
Perfil del indicador
Conversación
Valoraciones de clientes
4.3
Valoraciones: 3
5 | 33 % | |
4 | 67 % | |
3 | 0 % | |
2 | 0 % | |
1 | 0 % |
Valoraciones de clientes
May 18, 2025
It supports the plan without acting like the plan, but the first run should stay small enough to be boring.
May 14, 2025
May 11, 2025
Pretty decent as a backup check, especially in trend days. The result needs a journal.
Preguntas frecuentes
Breakout
Scalping
Los productos disponibles a través de cTrader Store, incluidos bots, indicadores y plugins para operar, son proporcionados por desarrolladores de terceros y están disponibles únicamente con fines informativos y de acceso técnico. cTrader Store no es un bróker, por lo que no proporciona asesoramiento de inversión, recomendaciones personales ni ninguna garantía de rentabilidad futura.
Más de este autor
Puede interesarle










Precio
Desde 02/02/2025
1
Ventas