
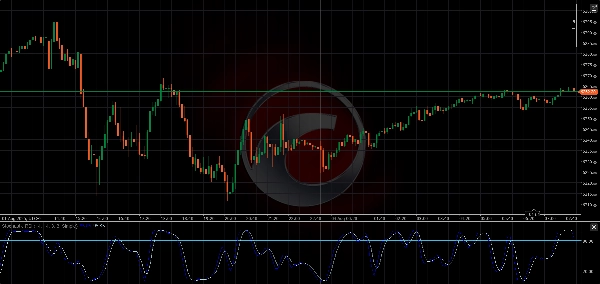
📈 Stochastic RSI
Indikator Stochastic RSI adalah osilator momentum yang menerapkan rumus Stochastic pada nilai RSI daripada harga, menjadikannya indikator turunan kedua. Ini sangat berguna untuk mengidentifikasi kondisi jenuh beli dan jenuh jual dengan sensitivitas lebih tinggi dibandingkan RSI standar.
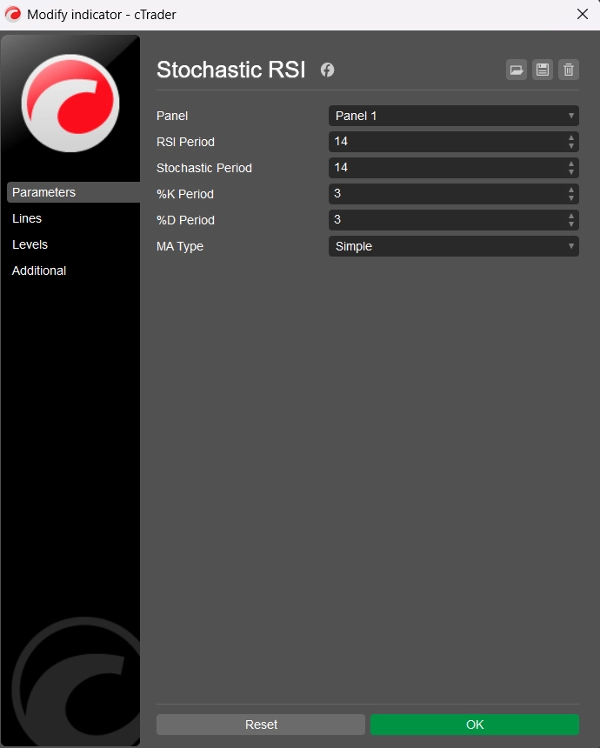
🛠️ Parameter
Periode RSI: Periode lookback yang digunakan untuk menghitung RSI dasar (default = 14)
Periode Stochastic: Periode lookback yang diterapkan pada nilai RSI untuk menghitung Stochastic RSI (default = 14)
Periode %K: Periode perataan untuk garis %K (default = 3)
Periode %D: Periode perataan untuk garis %D (default = 3)
Tipe MA: Tipe rata-rata bergerak untuk perataan: Simple atau Exponential (default = Simple)
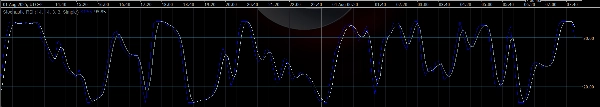
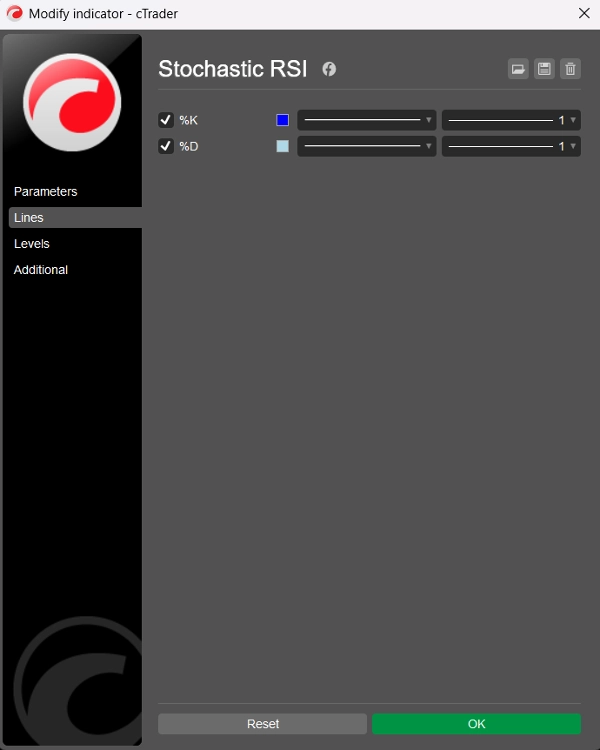
📊 Garis Output
- Garis %K: Stochastic RSI yang telah diratakan (biru)
- Garis %D: Rata-rata bergerak yang diratakan dari %K (biru muda)
Kedua garis berosilasi antara 0 dan 100, memungkinkan pembacaan jenuh beli dan jenuh jual yang jelas.
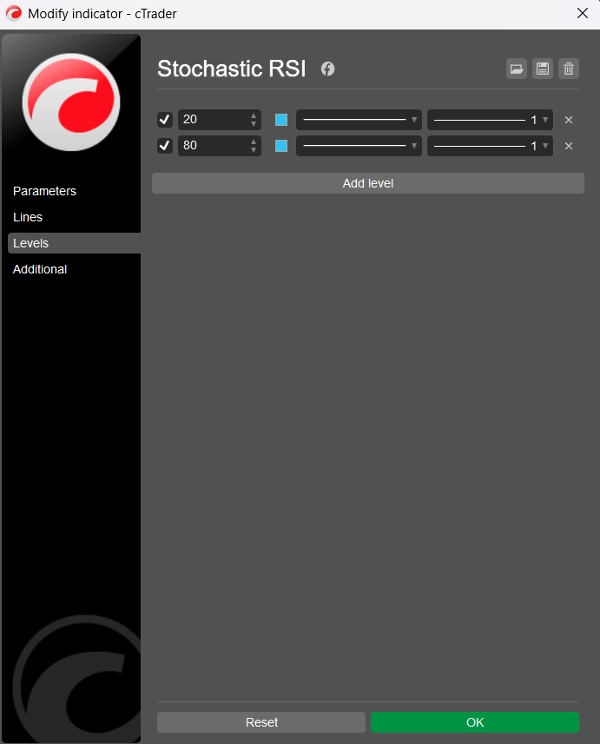
⚠️ Level yang Disarankan
Meskipun indikator tidak menampilkan level statis secara default, pengguna disarankan untuk menambahkannya secara manual melalui tab “Levels” di cTrader:
- Level 80 → Jenuh Beli
- Level 20 → Jenuh Jual
Level-level ini bekerja mirip dengan Stochastic Oscillator tradisional tetapi diterapkan pada perilaku RSI, membuat sinyal menjadi lebih tajam dan seringkali lebih cepat.
🧠 Cara Menggunakan
- Jenuh Beli (>80): Mungkin menunjukkan harga terlalu tinggi ke atas — potensi pembalikan atau konsolidasi.
- Jenuh Jual (<20): Mungkin menandakan harga terlalu rendah — kemungkinan pantulan atau pembalikan tren.
- Persilangan %K dan %D: Dapat digunakan mirip dengan Stochastic atau MACD — persilangan bullish di bawah 20 atau persilangan bearish di atas 80 mungkin dapat ditindaklanjuti.
🏷️ Catatan
- Dibuat untuk cTrader menggunakan C# dan Automate API
- Bersih, efisien, dan dapat disesuaikan dengan dua tipe MA
- Kode dan logika oleh BlueRocketBots & ChatGPT (OpenAI)
- Kode bersih (total 109 baris; 60 baris kode, 29 baris teks, 20 baris kosong)
- Gratis!


