Deskripsi
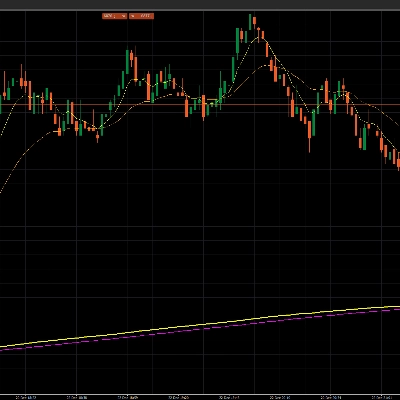
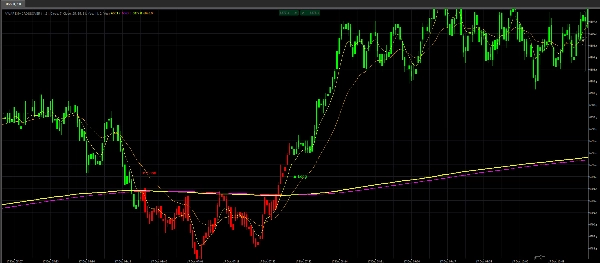
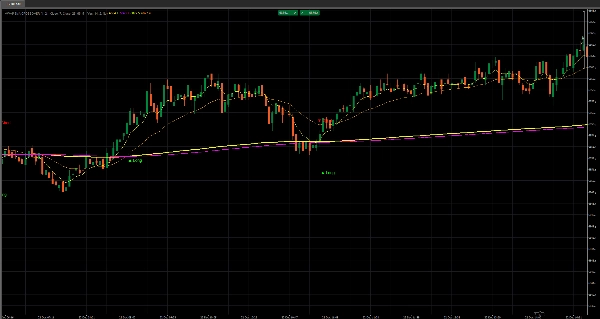
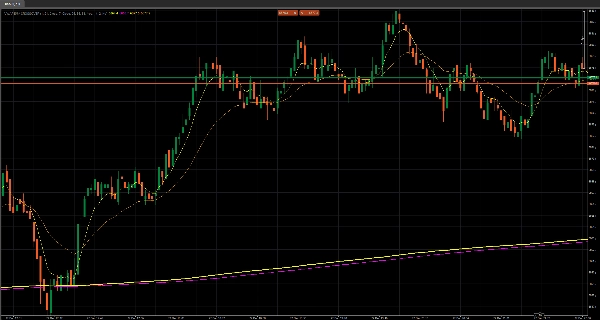
✅ VWAP (EMA) + MVWAP Mean Line — diplot langsung di grafik utama
✅ Dual EMA Crossover Engine (EMA1 + EMA2) — konfirmasi tren + momentum yang jelas
✅ Sinyal Long/Short Instan di grafik — label/panah dicetak pada pergeseran yang tepat
✅ Lilin Berwarna (Hijau/Merah) — bias langsung + visibilitas rezim, tanpa keraguan
✅ Reset VWAP Sesi Harian — setiap hari dimulai dengan baseline institusional yang bersih
✅ Offset Sinyal yang Dapat Disesuaikan + Ukuran Teks — sangat mudah dibaca di timeframe mana pun
✅ Desain Overlay yang Bersih — tanpa kekacauan subwindow, semuanya di tempat keputusan dibuat
VWAP / MVWAP / EMA Crossover — Overlay V2 adalah senjata grafik cepat dan tanpa basa-basi yang dibuat untuk satu tujuan: membuat bias dan entri Anda jelas secara real time.
Ini menempatkan lapisan keputusan terpenting langsung pada harga — tidak tersembunyi di panel — sehingga mata Anda tidak pernah meninggalkan aksi.
Keunggulan Inti: Rata-rata vs Momentum
Indikator ini menggabungkan dua kekuatan yang kuat:
- VWAP/MVWAP = tempat harga “seharusnya” berada (rata-rata / area wajar)
- Persilangan EMA = ketika momentum berkomitmen (pergeseran / konfirmasi)
Ketika keduanya selaras, Anda tidak menebak — Anda memperdagangkan kondisi yang terstruktur.
Lilin Berwarna: Fitur “Tidak Ada Lagi Kebingungan”
Pewarnaan lilin bukan sekadar kosmetik — itu adalah filter rezim langsung Anda.
- Lilin hijau = kondisi bullish aktif
- Lilin merah = kondisi bearish aktif
Ini mengubah grafik Anda menjadi sistem lampu lalu lintas: Anda langsung tahu kapan harus menekan posisi long, bersabar, atau berhenti memaksa perdagangan.
Untuk scalping dan pengambilan keputusan cepat, ini adalah pengubah permainan: lebih sedikit berpikir, lebih banyak eksekusi.
Sinyal di Grafik: Bersih, Terjadwal, Dapat Ditindaklanjuti
Anda mendapatkan penanda Long / Short yang dicetak di grafik pada saat kondisi berubah.
Artinya:
- Anda menangkap pergeseran lebih awal,
- Anda menghindari entri terlambat,
- Anda berhenti meragukan apa yang “dicoba dikatakan” grafik.
Sinyal ditempatkan dengan offset yang dapat disesuaikan dan ukuran yang mudah dibaca, sehingga tetap bersih bahkan pada grafik yang padat.
VWAP Reset Sesi: Baseline Baru Setiap Hari
Logika VWAP direset setiap hari, memberi Anda baseline sesi yang konsisten.
Artinya Anda selalu membaca harga relatif terhadap jangkar saat ini yang bermakna — bukan rata-rata yang usang.
Mengapa trader mempertahankan ini di grafik mereka
Karena ini memberikan tiga hal yang dibutuhkan setiap grafik:
- Bias (lilin berwarna + garis rata-rata)
- Konfirmasi (persilangan EMA ganda)
- Timing (pemicu Long/Short instan pada harga)
Jika Anda menginginkan overlay bersih yang mengubah lilin acak menjadi sistem yang dapat dibaca — ini adalah lapisan eksekusi plug-and-play Anda.


