
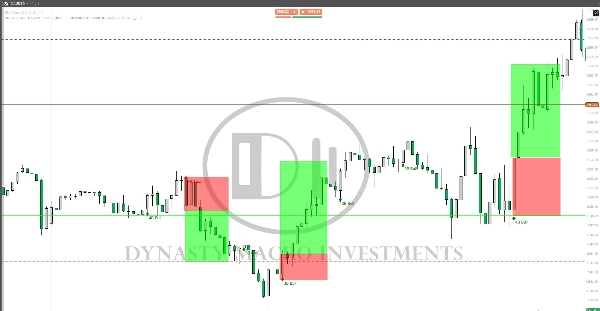
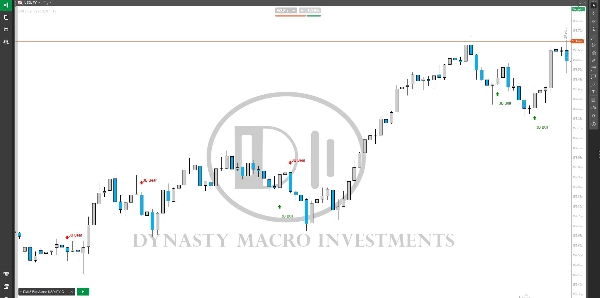
Morning Star On Chart
Indicador
Versión 1.0, Dec 2024
Windows, Mac
4.0
Valoraciones: 1
Descripción
Patrón Morning Star en el gráfico (alcista y bajista) marcado automáticamente con (COMPRAR & VENDER) Señales muy poderosas.
Resumen
Perfil del indicador
Valoraciones de clientes
4.0
Valoraciones: 1
5 | 0 % | |
4 | 100 % | |
3 | 0 % | |
2 | 0 % | |
1 | 0 % |
Conversación
Preguntas frecuentes
Los productos disponibles a través de cTrader Store, incluidos bots, indicadores y plugins para operar, son proporcionados por desarrolladores de terceros y están disponibles únicamente con fines informativos y de acceso técnico. cTrader Store no es un bróker, por lo que no proporciona asesoramiento de inversión, recomendaciones personales ni ninguna garantía de rentabilidad futura.
Más de este autor


Precio
2
Ventas