
Descripción
📊 Resumen
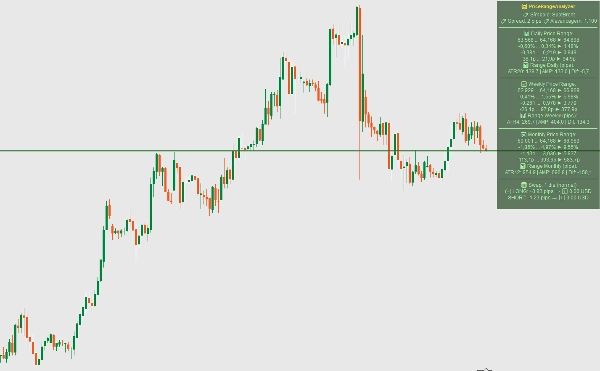
Panel de información comercial integral y multitemporal que consolida datos esenciales del mercado, análisis de rango basado en ATR y cálculos inteligentes de swap en una sola interfaz personalizable. Diseñado para traders serios que necesitan acceso rápido a métricas comerciales críticas en múltiples marcos temporales.
✨ Características Clave
Análisis Multitemporal
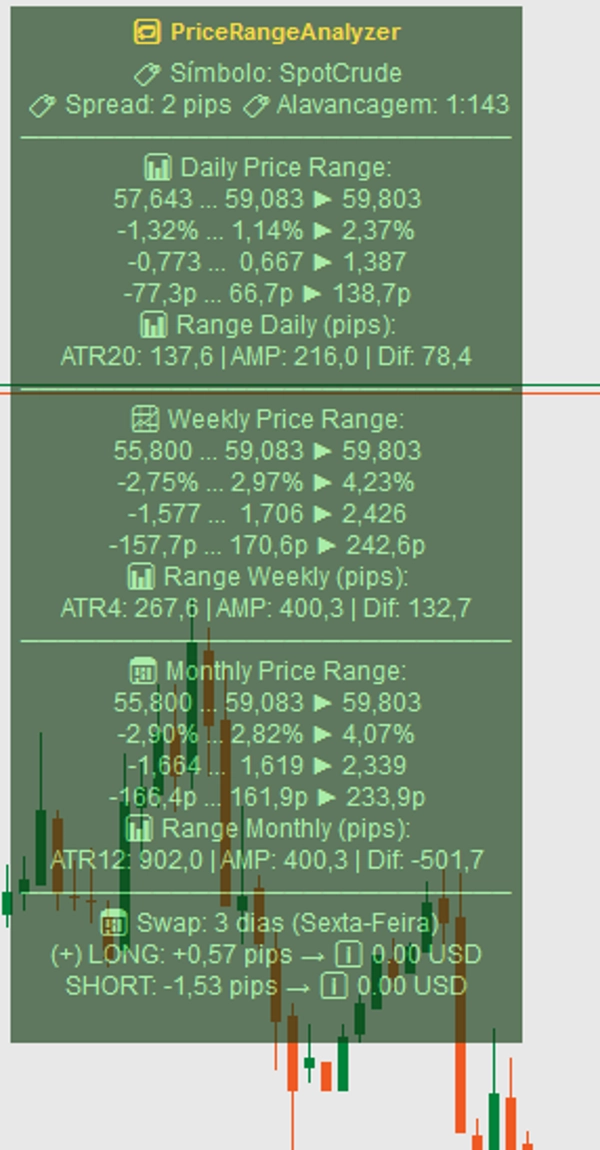
- Diarios, Semanales y Mensuales rangos y variaciones de precios
- Cálculos simultáneos de ATR para todos los marcos temporales con períodos personalizables
- Porcentaje en tiempo real y cálculos de cambio en pips
- Visualización del rango de precios con indicadores direccionales
Gestión Inteligente de Swap
- Detección automática de triple swap (miércoles y viernes)
- Listas de símbolos personalizables para diferentes horarios de swap
- Cálculo de swap en tiempo real para posiciones abiertas
- Soporte para símbolos basados en % y en pips
Visualización Profesional
- Posición del panel totalmente personalizable (4 esquinas)
- Esquema de colores dinámico basado en la dirección del mercado
- Tamaño de fuente ajustable y opacidad
- Diseño limpio y organizado de la información
⚙️ Parámetros
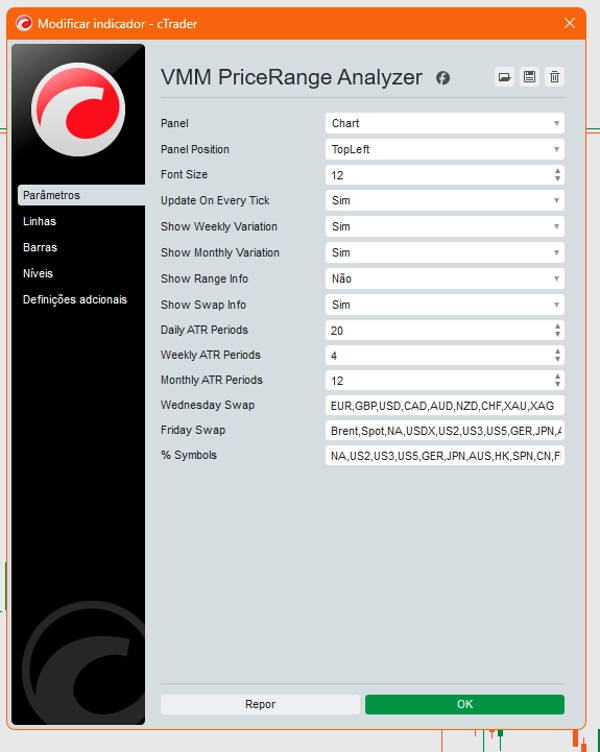
Configuración del Panel
Panel Position- Elija entre 4 esquinas de la pantalla (TopLeft, TopRight, BottomLeft, BottomRight)Font Size- Ajuste el tamaño del texto para mejor legibilidadUpdate On Every Tick- Actualizaciones en tiempo real o solo al cierre de barraShow Weekly Variation- Alternar visualización de datos semanalesShow Monthly Variation- Alternar visualización de datos mensualesShow Range Info- Mostrar información detallada del rangoShow Swap Info- Mostrar cálculos de swap
Configuración de ATR
Daily ATR Periods- Períodos para cálculo diario de ATR (1-100)Weekly ATR Periods- Períodos para cálculo semanal de ATR (1-100)Monthly ATR Periods- Períodos para cálculo mensual de ATR (1-100)
Configuración de Símbolos
Wednesday Swap- Símbolos separados por comas con triple swap el miércolesFriday Swap- Símbolos separados por comas con triple swap el viernes% Symbols- Símbolos donde los valores son basados en porcentaje vs basados en pips
🔧 Cómo Funciona
Análisis de Rango
Calcula y muestra:
- Precio actual relativo a los rangos diarios/semanales/mensuales
- Cambios porcentuales desde cierres previos
- Movimientos en pips para planificación precisa de entrada/salida
- Mediciones de volatilidad basadas en ATR
Inteligencia de Swap
- Detecta automáticamente cuando aplica el triple swap
- Calcula costos de swap para posiciones largas y cortas
- Muestra costos reales de swap para posiciones abiertas actualmente
- Soporta diferentes tipos de símbolos con cálculos apropiados
Indicadores Visuales
- Los colores del panel cambian según la dirección diaria del mercado
- Panel verde para días alcistas, rojo para bajistas
- Flechas direccionales claras que muestran el movimiento del precio
- Secciones organizadas con separadores para fácil lectura
🎯 Casos de Uso
Para Traders de Posición
- Monitorear rangos multitemporales para mejor sincronización de entrada
- Entender costos de swap antes de mantener posiciones durante la noche
- Rastrear desarrollos de precios semanales y mensuales
Para Traders Diarios
- Acceso rápido a información de spread y apalancamiento
- Monitorear rango diario y ATR para evaluación de volatilidad
- Planificar operaciones basadas en niveles diarios de máximo/mínimo
Para Todos los Traders
- Vista consolidada de métricas comerciales críticas
- Prevención de errores costosos en cálculos de swap
- Interfaz profesional y limpia que ahorra espacio en pantalla
📈 Beneficios
- Ahorro de Tiempo - Toda la información esencial en un solo lugar
- Prevención de Errores - Cálculos automáticos de swap
- Mejores Decisiones - Perspectiva multitemporal
- Personalizable - Se adapta a tu estilo de trading
- Profesional - Visualización limpia y de nivel institucional
⚡ Rendimiento
- Optimizado para uso mínimo de CPU
- Actualiza solo cuando es necesario (configurable)
- Gestión eficiente de memoria para sesiones de larga duración
¡Perfecto para traders que desean inteligencia de mercado de nivel profesional sin cambiar entre múltiples ventanas o calculadoras!
Resumen
Valoraciones de clientes
5 | 100 % | |
4 | 0 % | |
3 | 0 % | |
2 | 0 % | |
1 | 0 % |


![Logotipo de "[Hamster-Coder] Pivot Points MTF"](https://cdn.ctrader.com/image/webp/4c143e5a-309c-40e3-a578-f04d1e133ffa_31159)


