الوصف
مؤشر سكالبينج مدمج لـ cTrader يجمع بين ثلاثة أشياء في طبقة نظيفة واحدة: VWAP يومي قائم على الجلسة، دليل نطاق الافتتاح، فقاعات "دلتا/القوة" كعلامات زخم/نشاط، ومناطق العرض/الطلب الديناميكية مع حالة اختبار/تأكيد بالإضافة إلى فلتر اتجاه اختياري. علاوة على ذلك، يتضمن ضوء مرور متعدد الأطر الزمنية يُظهر، بنظرة سريعة، اتجاه الشمعة المغلقة حديثًا عبر عدة أطر زمنية (VWAP + نطاق الافتتاح).
ملاحظة: تم تصميم المعلمات عمدًا بحيث يمكنك تكييف الأداة بسرعة مع سوقك/الإطار الزمني الخاص بك؛ المنطق يعمل تلقائيًا في الخلفية.
ما تحصل عليه (الميزات)
- VWAP يومي (يُعاد تعيينه كل يوم تداول): يصور "سعر الجلسة" العادل ويساعد في الانعكاس المتوسط، والتراجعات، والانحياز الاتجاهي
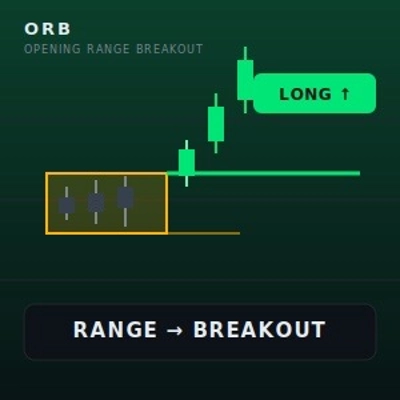
- نطاق الافتتاح (OR) الأعلى/الأدنى: يرسم نطاق الافتتاح بحيث يمكنك هيكلة إعدادات الاختراق/الانعكاس (دقائق محددة تلقائيًا أو يدويًا)
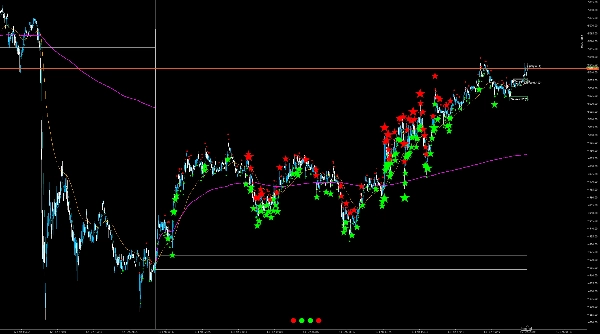
- فقاعات دلتا/القوة: تبرز الشموع ذات النشاط الأعلى من المتوسط (حسب الوضع: ارتفاع الحجم، حجم الجسم/النطاق، أو وكيل دلتا) وتلوّنها حسب الاتجاه (صعودي/هبوطي)
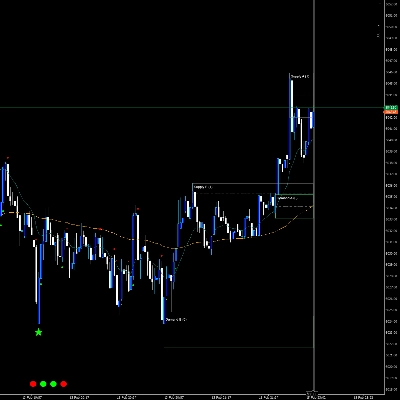
- مناطق العرض/الطلب (مجموعتا محاور A/B): مناطق تلقائية من قمم/قيعان المحاور المؤكدة، مع عمق المنطقة بناءً على ATR، وتمديد محدد على الجانب الأيمن، وخط وسط اختياري
- حالة المنطقة: "جديدة → مُختبرة → مؤكدة" (التأكيد اختياري عبر شرط حجم) بحيث يمكنك رؤية ما إذا تم التداول داخل المنطقة بالفعل وما إذا كانت قد تفاعلت بقوة
- فلتر الاتجاه (اختياري): فلتر EMA أو EMA+ADX بحيث تُعرض/تُؤخذ المناطق في الاعتبار فقط في اتجاه الاتجاه (مثلاً، مناطق الطلب فقط في اتجاه صاعد)
- ضوء مرور متعدد الأطر الزمنية: يعرض M1/M5/H1/D1 بالأخضر/الأحمر/الرمادي حسب الشمعة المغلقة الأخيرة—سياق مفيد دون الحاجة لتغيير أطر زمنية للرسم البياني
ما يمكن للمشترين تكوينه (نظرة عامة على المعلمات)
الإعدادات مجمعة وعمليّة عمدًا:
الأساسي
- طول ATR: الإدخال الأساسي لعمق المنطقة وبعض مقاييس الفقاعات
- عرض VWAP اليومي: تشغيل/إيقاف
- عرض نطاق الافتتاح: تشغيل/إيقاف
- وضع OR: تلقائي (يعتمد على إطار الرسم البياني) أو يدوي (دقائق ثابتة)
- عامل OR التلقائي / دقائق OR: ضبط دقيق لمدة OR
فلتر الاتجاه
- الوضع: إيقاف / EMA / EMA+ADX
- EMA سريع / EMA بطيء: اتجاه الاتجاه عبر تقاطع/علاقة EMA
- طول ADX + العتبة: الحد الأدنى لقوة الاتجاه عند تمكين EMA+ADX
- رسم خطوط EMA: عرض اختياري لخطوط EMA للفلتر على الرسم البياني
الفقاعات
- عرض الفقاعات: تشغيل/إيقاف
- وكيل دلتا: ثلاثة أنواع (مرجح بالنطاق، الإغلاق مقابل السابق، الإغلاق مقابل الافتتاح) حسب الأداة/التغذية
- مقياس الفقاعة: تلقائي أو مقياس ثابت (دلتا مطلقة، ارتفاع الحجم، حجم الجسم/النطاق)
- نظرة خلفية للكمية + نسبة الكمية: يتحكم في مدى "ندرة" إشارة الفقاعة (نسبة أعلى = فقط الأحداث الأقوى)
- حد التسمية: عدد تسميات الفقاعات التي تبقى على الرسم البياني (الأداء/الوضوح)
- الخط الأساسي + وضع 4K: مقياس بصري لشاشات الدقة العالية
- شكل الرمز صغير/كبير: شكل الفقاعة (نقطة/دائرة، إلخ)
- تصحيح الأخطاء: فرض الفقاعات (للاختبار فقط)
المناطق
- عرض المناطق: تشغيل/إيقاف
- عمق المنطقة × ATR: سمك المنطقة (متكيف مع التقلب)
- التمديد (الأشرطة): مدى امتداد المناطق إلى اليمين
- عرض الخط الأوسط: تشغيل/إيقاف
- المناطق داخل الاتجاه فقط: عرض المناطق فقط عندما يتطابق اتجاه فلتر الاتجاه
- معلمات المحور A & B (يسار/يمين): حساسيتان (مثلاً، مناطق "خشنه" + "ناعمة")
- حجم تسمية المنطقة: صغير/متوسط/كبير
- الألوان (ARGB): ألوان منفصلة للعرض/الطلب، المختبرة، المؤكدة + الخط الأوسط
- التأكيد بالحجم + متوسط الحجم/المضاعف: التأكيد فقط إذا كان حجم التيك أعلى من المتوسط × العامل
ضوء المرور
- عرض ضوء المرور: تشغيل/إيقاف
- الخط + مقياس 4K: الحجم/الوضوح
- التحديث كل N شريط: تكرار التحديث (الأداء مقابل الاستجابة)
(يمكن تقديم وصف حقول المعلمات بشكل نظيف عبر خاصية/أوصاف المعلمات؛ المنصة تدعم التجميع والوصف مباشرة في واجهة المستخدم الخاصة بالمعلمات.)
لمن هو
- المتداولون السريعون والمتداولون داخل اليوم الذين يحتاجون إلى سياق سريع: VWAP/OR للهيكل، الفقاعات لـ "النشاط"، المناطق لمناطق التفاعل
- المتداولون الذين يريدون تصورًا واضحًا دون تكديس مؤشرات متعددة
- المستخدمون الذين قد يرغبون في عرض مفلتر باتجاه اختياري (EMA/ADX)، مع الحفاظ على الأساسي كعرض تشغيل مباشر
الاستخدام النموذجي (قصير وعملي)
تحقق من الانحياز عبر VWAP + ضوء المرور، واستخدم OR كـ "منطقة المعركة" خلال مرحلة الافتتاح.
استخدم الفقاعات كدليل على أن "شيئًا فوق المتوسط يحدث هنا" (اختراق، امتصاص، اندفاع).
استخدم المناطق كمناطق تخطيط: اللمسة الأولى = "مختبرة"؛ يمكن تمييز رد فعل بحجم مرتفع كـ "مؤكد"؛ يساعد الخط الأوسط في التداول النظيف من مستوى إلى مستوى.