
Pulse Radar: Professional Momentum & Cycle Dynamics Analysis
The Pulse Radar indicator is an advanced analytical suite for C#-driven platforms, engineered to decode market volatility and identify high-probability price development phases. Unlike lagging traditional indicators, Pulse Radar employs an adaptive evaluation of price equilibrium zones, providing a clear structural map of the market.
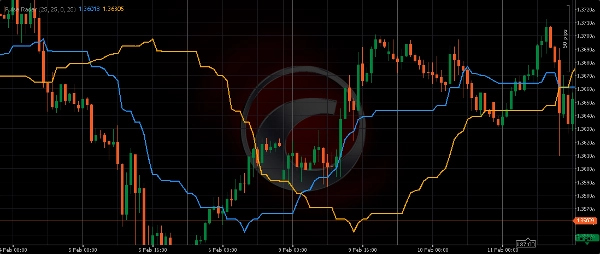
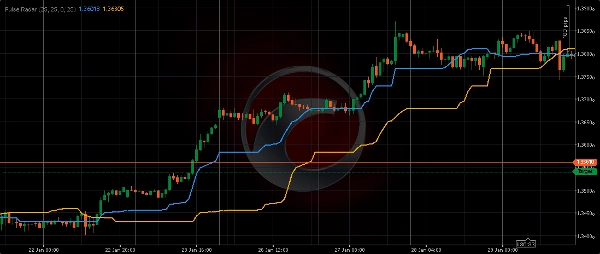
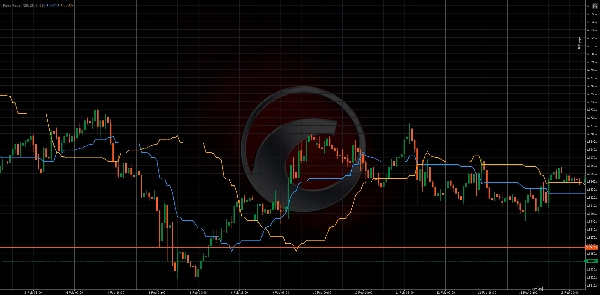
The system constructs two proprietary analytical curves:
- Active Vector (Fast): A high-responsiveness line reflecting immediate momentum and short-term liquidity shifts.
- Strategic Vector (Slow): A smoothed curve representing the dominant market cycle and institutional price balance.
By analyzing the price position relative to these curves, traders can accurately pinpoint the current market phase within a broader cyclical hierarchy. Pulse Radar also features advanced historical alignment, allowing for a direct comparison between current structural movements and past behavioral patterns.
Technical Methodology
- Extreme-Point Analysis: Lines are computed based on raw price extremes within specific look-back windows, eliminating the noise found in standard moving averages.
- Phase Synchronization: The algorithm supports manual and automatic offset adjustments to align data with historical chart segments.
- Structural Interaction: The convergence and divergence of the Active and Strategic vectors highlight transitions between trend accumulation and distribution phases.
Key Advantages
- Zero-Smoothing Precision: Calculations utilize raw market data, ensuring no artificial lag is introduced.
- Adaptive Framework: Fully configurable parameters to match any asset’s specific volatility profile.
- Cross-Market Utility: Optimized for High-Frequency Forex, US Equities, Commodities, and Crypto.
- High-Performance Architecture: Lightweight C# logic ensures zero impact on platform stability during high volatility.
Input Parameters
- Reach Period (Fast/Slow): Defines the depth of market data used for calculating the momentum vectors.
- Phase Shift (Fast/Slow): Allows for precise calibration of the analytical lines against historical price structures.
5 | 100 % | |
4 | 0 % | |
3 | 0 % | |
2 | 0 % | |
1 | 0 % |


