
Descripción
Price Magnet: Densidad de Precio Avanzada y Niveles Institucionales
Price Magnet es una herramienta analítica profesional para cTrader diseñada para revelar dónde el "Dinero Inteligente" acumula posiciones. A diferencia de los osciladores estándar o indicadores de tendencia, Price Magnet utiliza un enfoque matemático para identificar zonas de máximo interés del mercado calculando Densidad de Precio.
Cómo Funciona
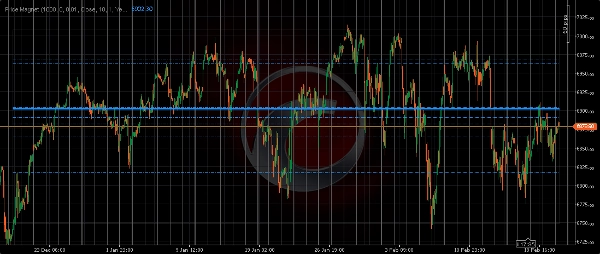
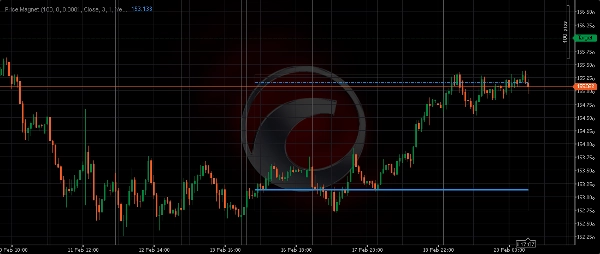
El mercado a menudo regresa a niveles donde ha pasado más tiempo. Estos son los "Imanes". Este indicador escanea una profundidad histórica específica, agrupa la acción del precio en grupos de frecuencia y resalta los niveles más fuertes que probablemente actúen como imanes futuros para el precio.
Guía Detallada de Parámetros
Para aprovechar al máximo Price Magnet, es esencial entender su configuración:
- Profundidad de Análisis (Barras): Determina cuántas velas históricas analiza el indicador.
-
- Corto plazo (50-100): Ideal para scalping y trading diario.
- Largo plazo (300-500): Mejor para identificar zonas institucionales principales de "S&R".
- Desplazamiento hacia Atrás: Permite desplazar la ventana de análisis hacia el pasado. Útil para probar cómo las zonas de densidad históricas influyeron en movimientos posteriores del precio.
- Paso de Agrupación (Precio): La configuración más crítica. Define la "sensibilidad" del imán.
- Fuente del Precio: Elige qué parte de la vela analizar.
-
- Cierre: Análisis estándar.
- Mediana / Típico: A menudo más preciso ya que considera todo el rango de la vela.
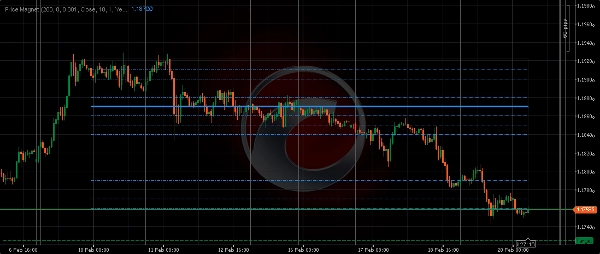
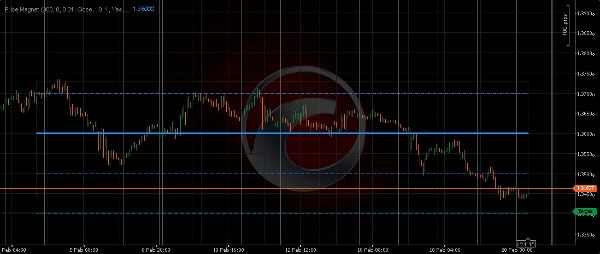
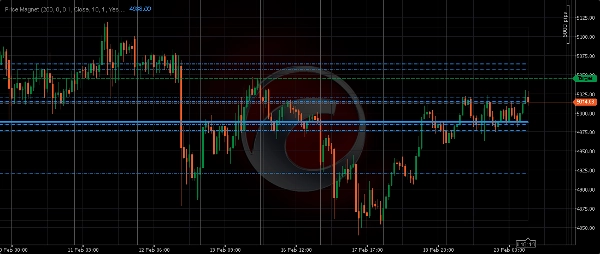
- Niveles a Mostrar: Define cuántos niveles magnéticos dibujar (de 1 a 10). El nivel más frecuente siempre se dibuja con una línea más gruesa.
- Configuración Visual (Mostrar Zona/Líneas de Densidad): Activa o desactiva el rectángulo de fondo (Zona) y las líneas horizontales. La Zona representa los límites totales de la acción del precio analizada, proporcionando una visual clara del rango de negociación actual.
Consejos de Estrategia de Trading
- Reversión a la Media: Cuando el precio se desvía significativamente de la "Línea Principal del Imán", busca señales de agotamiento para operar un retorno al imán.
- Confirmación de Ruptura: Si el precio rompe un Nivel de Imán fuerte y lo retesta, ese nivel a menudo cambia de resistencia a soporte.
- Objetivos de Toma de Ganancias: Usa niveles magnéticos secundarios como objetivos para tus operaciones.
Price Magnet simplifica datos complejos del perfil del mercado en niveles visuales accionables, dándote una ventaja profesional en cualquier condición de mercado.
Resumen
Valoraciones de clientes
5 | 50 % | |
4 | 25 % | |
3 | 25 % | |
2 | 0 % | |
1 | 0 % |


