
Volume_Momentum_HeatMap-Liquidity-style
インジケーター
バージョン 2.0、Apr 2026
Windows、Mac
4.5
レビュー: 4
説明
なぜこのインジケーターがトレーダーにとって価値があるのか
- 重要なレベルを特定する: POC、VAH、およびVALは客観的なサポート/レジスタンスレベルです。
- ボリュームベースの取引: トレーダーが流動性が集中している場所を把握するのに役立ちます。
- 適応性: どのタイムフレームや資産クラス(FX、株式、暗号通貨など)でも機能します。
- カスタマイズ可能: トレーダーは自分のスタイルに合わせて設定を調整できます。
- プロフェッショナルグレード: 機関投資家や個人トレーダーによるオーダーフロー分析に使用されています。
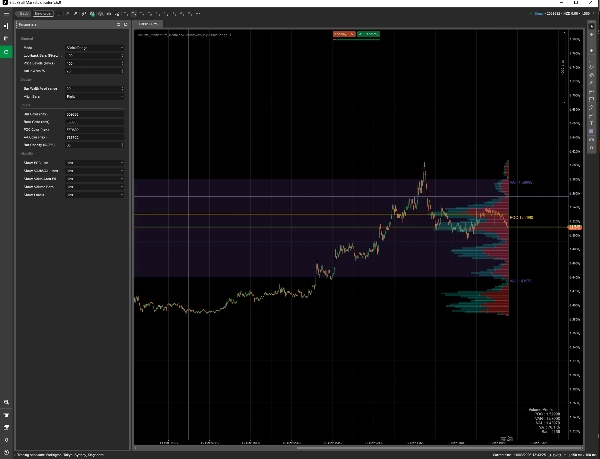
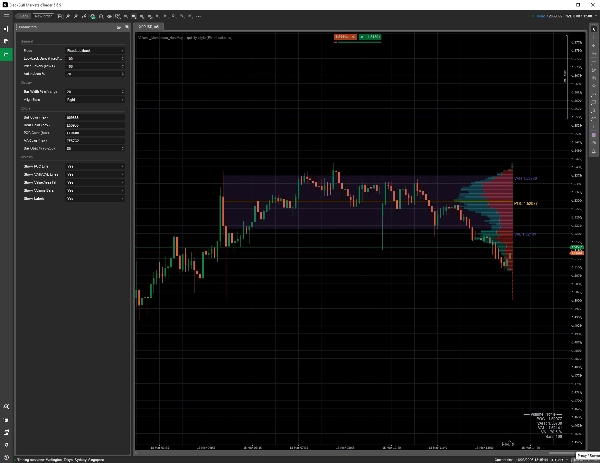
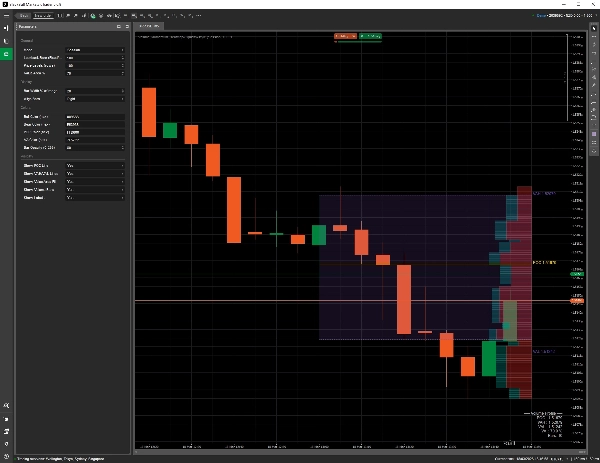
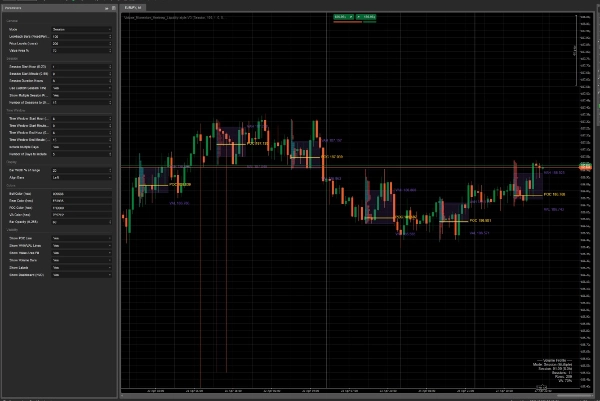
視覚的要素 - POC(ポイント・オブ・コントロール): 最も取引量が多い価格レベル(黄色の線)。価格の磁石のように作用します。
- VAH/VAL(バリューエリア高値/安値): 70%のバリューエリア(デフォルト)の上限と下限で、取引量の70%が発生した範囲。このエリアはしばしばサポート/レジスタンスとして機能します。
- バリューエリアフィル: VAHとVALの間の半透明の帯で、バリューエリアを視覚的に強調します。
- HVN(ハイボリュームノード): 強力なサポート/レジスタンスゾーンを示す幅の広いバー。
- LVN(ローボリュームノード): 価格が速く動くエリア(ブレイクアウト/ストップランゾーン)を示す細いバー。
2. プロファイルモード
- 可視範囲: 現在のチャートビュー(ズーム/スクロール)に適応します。
- 固定ルックバック: 最後のN本のバーを使用(設定可能)。
- セッション: 現在の取引日のボリュームのみを表示します。
3. カスタマイズオプション
- 行数: 表示する価格レベル(行)の数。
- バリューエリア%: バリューエリアに含める取引量の割合を調整(デフォルト:70%)。
- バーの幅と配置: ボリュームバーの幅と配置を制御します。
- 色と不透明度: ブル/ベアのボリューム、POC、VA、および不透明度の色をカスタマイズします。
- 表示/非表示: POC、VAH/VAL、バリューエリアフィル、ボリュームバー、ラベルの表示/非表示を切り替えます。
4. 対応する取引戦略
- HVNリトレースメント: POCまたは高ボリュームノードでの反発を取引します。
- LVNブレイクアウト: 価格が低ボリュームノードを突破したときにモメンタム取引に入ります。
- バリューエリアフェード: バリューエリア外での逆張り(平均回帰)を行います。
- デイリーオープンバイアス: 日々の始値とPOCを比較してトレンド方向を判断します。
購入検討者からの質問と回答
- Q: すべてのタイムフレームで機能しますか?
A: はい、どのタイムフレームやチャートビューにも適応します。 - Q: 色を変更できますか?
A: はい、すべての色と不透明度はカスタマイズ可能です。 - Q: スキャルピングに適していますか?
A: もちろんです。特に「セッション」モードは日中取引に最適です。 - Q: 再描画されますか?
A: いいえ、新しいデータが利用可能になったときやチャートビューが変わったときのみ再計算されます。
概要
インジケーターのプロフィール
インジケーターのカテゴリー
モメンタム
出力の種類
ビジュアル表示
データ要件
取引高
サポート対象のシグナル
ボラティリティ
ラインタッチ
セッション開始レンジ
カスタマーレビュー
4.5
レビュー: 4
5 | 50 % | |
4 | 50 % | |
3 | 0 % | |
2 | 0 % | |
1 | 0 % |
カスタマーレビュー
March 31, 2026
Not some auto win thing, but it has a clear role. It helps with smart money style analysis, while the weak spot is that zones still need manual validation. Early sizing should stay modest until the journal looks stable.
March 24, 2026
Tbh the value is mostly in filtering bad ideas. I still would not trust it live without checking the chart myself. The weak spot shows up when risk stops matching the setup.705 caution area.
March 22, 2026
the product feels more useful when the plan is already written down. A 97 setup run on daily close keeps the review grounded.
March 22, 2026
After 3 sessions, the useful part became clearer. 20 FVG reactions was enough to see whether it helped, and 0.5 mitigation kept the test grounded.
ディスカッション
よくあるご質問
Scalping
cTrader Storeで入手可能な取引ボット、インジケーター、プラグインなどの商品は、第三者の開発者が提供するものであり、情報と技術の取得のみを目的としてご利用いただけます。cTrader Storeはブローカーではなく、投資助言や個人的な推奨を行うことも、将来のパフォーマンスを保証することもありません。
この作成者の他の商品

これも好きかも


価格
登録日 23/04/2025
2
販売