คำอธิบาย
ตัวบ่งชี้ cTrader นี้ระบุและแสดงภาพ ความไม่สมดุลของตลาดเฉพาะครั้งแรก ที่เกิดขึ้นในช่วงสามช่วงเวลาการซื้อขายหลักของนิวยอร์ก ออกแบบมาสำหรับผู้ปฏิบัติงาน ICT (Inner Circle Trader) ที่เน้นการตั้งค่า "ครั้งแรกที่นำเสนอ" เป็นรอยเท้าของสถาบันที่มีความน่าจะเป็นสูง
ฟังก์ชันหลัก (Core)
ตัวบ่งชี้จะตรวจสอบตลาดตั้งแต่เปิดแต่ละช่วงเวลาและ "ล็อก" ความไม่สมดุลครั้งแรกที่พบ เมื่อมีการวาดความไม่สมดุลประเภทหนึ่ง (เช่น FVG) สำหรับช่วงเวลาหนึ่ง จะไม่วาดอีกครั้งจนกว่าช่วงเวลาถัดไปจะเริ่มต้น
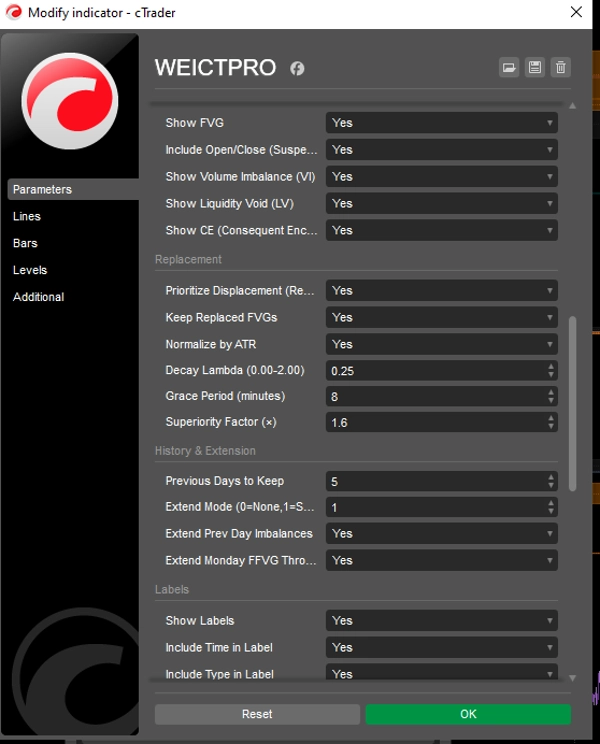
1. ประเภทความไม่สมดุลที่ตรวจพบ
- ช่องว่างมูลค่ายุติธรรม (FVG): โครงสร้างสามแท่งเทียนที่ไส้เทียนแท่งแรกและแท่งที่สามไม่ทับซ้อนกัน ทิ้ง "ช่องว่าง" ในช่วงราคาของแท่งเทียนที่สอง
- ความไม่สมดุลของปริมาณ (VI): เกิดขึ้นเมื่อมีช่องว่างระหว่าง ตัวแท่ง (เปิด/ปิด) ของแท่งเทียนสองแท่งติดต่อกัน แม้ว่าจะมีการทับซ้อนของไส้เทียน
- ช่องว่างสภาพคล่อง (LV): ช่องว่างที่รุนแรงมากขึ้นซึ่งไม่มีการเคลื่อนไหวของราคาเลยระหว่างไส้เทียนของแท่งเทียนสองแท่งติดต่อกัน (เป็นการ "กระโดด" ของราคาโดยสมบูรณ์)
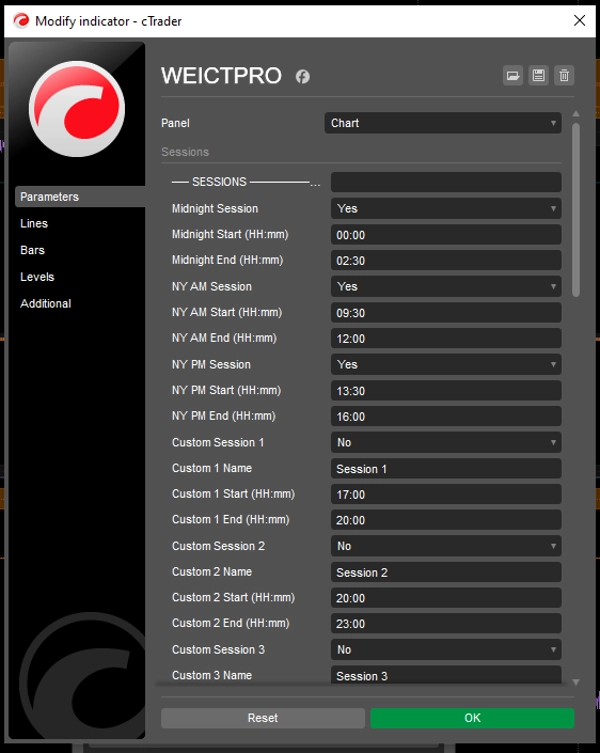
2. ช่วงเวลาที่ตรวจสอบ (เวลานิวยอร์ก)
ตัวบ่งชี้จะแปลงเวลาบนชาร์ตของคุณเป็น เวลาตะวันออก (ET) เพื่อการติดตาม:
- เที่ยงคืน: 00:00 – 02:30
- เช้านิวยอร์ก: 09:30 – 12:00
- บ่ายนิวยอร์ก: 13:30 – 16:00
คุณสมบัติด้านภาพ
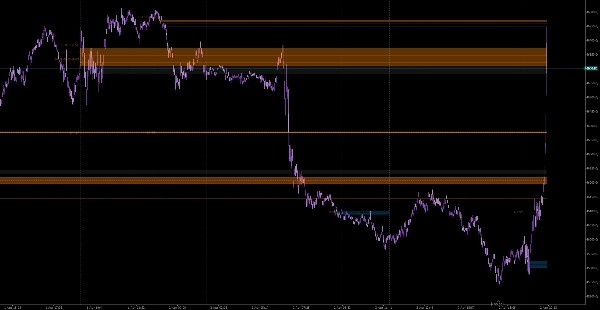
- การขยายแบบไดนามิก: กล่องถูกวาดจากจุดเริ่มต้นและขยายไปข้างหน้าโดยอัตโนมัติตามจำนวนแท่งที่ผู้ใช้กำหนด (
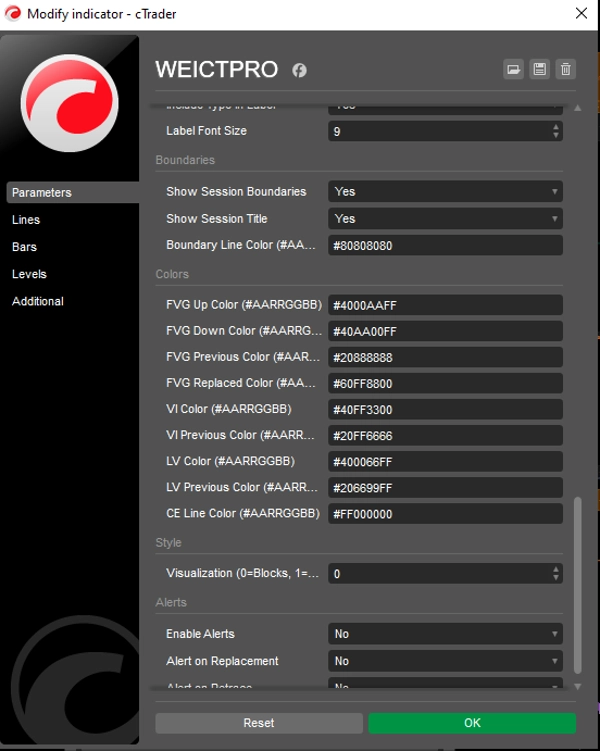
Extend Bars) เพื่อแสดงการสนับสนุน/ต้านทานในอนาคตที่เป็นไปได้ - การบุกรุกตามมา (CE): วาดเส้นกลางแบบประที่ผ่านความไม่สมดุล ในทฤษฎี ICT ระดับ 50% (CE) เป็นจุดอ้างอิงสำคัญของสถาบัน
- การติดป้ายอัตโนมัติ: ทำเครื่องหมายแต่ละกล่องอย่างชัดเจนด้วยชื่อช่วงเวลาและประเภทความไม่สมดุล (เช่น "NY AM +FVG")
พารามิเตอร์สำคัญ
พารามิเตอร์
คำอธิบาย
แสดง FVG/VI/LV
สลับประเภทความไม่สมดุลเฉพาะที่คุณต้องการติดตาม
ความทึบของกล่อง
ปรับความ "ทึบ" ของพื้นที่ที่ถูกแรเงาบนชาร์ตของคุณ
ขยายแท่งเทียน
จำนวนแท่งเทียนในอนาคตที่กล่องควรฉายภาพ
โซนเวลา
ตั้งค่าเป็นเวลามาตรฐานตะวันออกเพื่อความแม่นยำของช่วงเวลาการซื้อขายไม่ว่าจะใช้เวลาของเซิร์ฟเวอร์โบรกเกอร์ใด
คำแนะนำทางเทคนิค
- กรอบเวลา: ใช้ได้ดีที่สุดใน M1 ถึง M15 ในกรอบเวลาที่สูงกว่า (H1+) ช่วงเวลาสั้นเกินไปที่จะจับความไม่สมดุล "ครั้งแรก" ได้อย่างน่าเชื่อถือ
- การใช้งาน: พื้นที่เหล่านี้มักทำหน้าที่เป็น "แม่เหล็ก" สำหรับราคา เทรดเดอร์จะมองหาราคากลับมายังกล่องเหล่านี้ (โดยเฉพาะระดับ CE) เพื่อเข้าทำรายการก่อนที่จะดำเนินไปในทิศทางเดิม
สรุป
The indicator detects three imbalance types: Fair Value Gap (FVG), a three-candle gap where the first and third candle wicks do not overlap; Volume Imbalance (VI), a gap between the bodies of two consecutive candles; and Liquidity Void (LV), a total price jump with no price action between consecutive candle wicks. Once an imbalance type is identified in a session, it locks and does not redraw until the next session.
Visual features include dynamically extending boxes from the imbalance origin for a user-defined number of bars, a dashed midline marking the 50% level (Consequent Encroachment), and automated labeling with session and imbalance type. The indicator is hardcoded to Eastern Time for session accuracy and is best used on M1 to M15 timeframes to reliably capture the first imbalance. Users can toggle imbalance types, adjust box opacity, and set extension length. This tool supports multiple markets including Forex, indices, commodities, stocks, and cryptocurrencies.