present
ลงทะเบียนและรับส่วนลด $50 สำหรับการซื้อครั้งแรกของคุณ
Trading product for Supply Demand Detector อินดิเคเตอร์ Supply & Demand, image 1
Supply Demand Detector
อินดิเคเตอร์
1 ดาวน์โหลด
เวอร์ชัน 1.0, May 2026
Windows, Mac
Trading product for Supply Demand Detector อินดิเคเตอร์ Supply & Demand, image 2
Trading product for Supply Demand Detector อินดิเคเตอร์ Supply & Demand, image 3
Trading product for Supply Demand Detector อินดิเคเตอร์ Supply & Demand, image 4
ตั้งแต่ 13/05/2026
1
ติดตั้งฟรี

คำอธิบาย

วิธีการทำงานของตัวตรวจจับโซนอุปสงค์และอุปทาน:

1. การตรวจจับแรงกระตุ้น (การค้นหากิจกรรมสถาบัน)

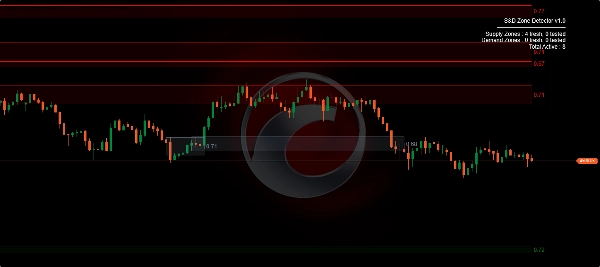
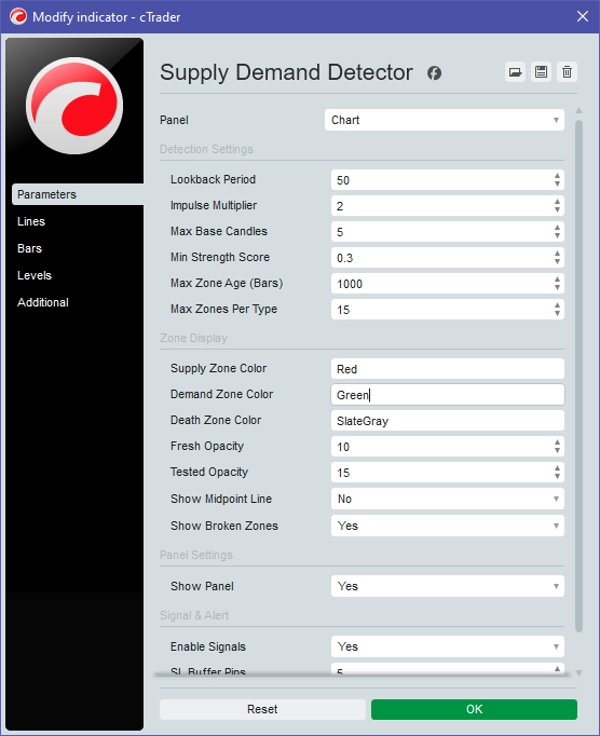
อัลกอริทึมจะคำนวณขนาดเฉลี่ยของแท่งเทียน 50 แท่งล่าสุดอย่างต่อเนื่อง (ปรับได้ผ่าน Lookback Period) เมื่อมันตรวจพบแท่งเทียนที่มีขนาดใหญ่กว่าค่าเฉลี่ยนี้อย่างมีนัยสำคัญ (ควบคุมโดย Impulse Multiplier ค่าเริ่มต้น 1.2x) มันจะทำเครื่องหมายว่าเป็น Impulse Candle.

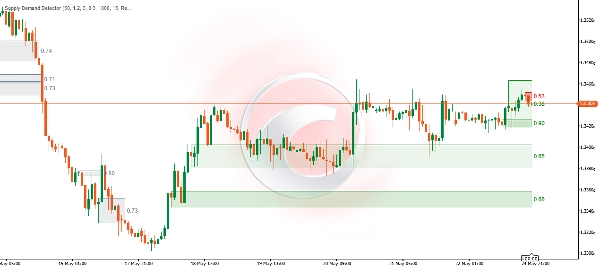
  • แรงกระตุ้นขาขึ้น: บ่งชี้การซื้อของสถาบัน สร้าง โซนอุปสงค์.
  • แรงกระตุ้นขาลง: บ่งชี้การขายของสถาบัน สร้าง โซนอุปทาน.

2. การระบุฐาน (การวาดโซน)

เมื่อมีการตรวจจับแรงกระตุ้น ตัวบ่งชี้จะมองย้อนกลับไปหาแท่งเทียนขนาดเล็กที่อยู่รวมกัน (ขนาดแท่งเทียน < 50% ของค่าเฉลี่ย) ที่อยู่ก่อนหน้าแรงกระตุ้นทันที เหล่านี้คือ แท่งเทียนฐาน.

  • ส่วน บน ของโซนคือจุดสูงสุดของแท่งเทียนฐานเหล่านี้.
  • ส่วน ล่าง ของโซนคือจุดต่ำสุดของแท่งเทียนฐานเหล่านี้.

3. การให้คะแนนความแข็งแกร่ง

ตัวบ่งชี้จะคำนวณคะแนนความแข็งแกร่ง (จาก 0.00 ถึง 1.00) โดยอิงจากสามปัจจัย:

  1. ขนาดแรงกระตุ้น: ขนาดของแท่งเทียนเบรกเอาท์.
  2. หลังการเคลื่อนไหว: ระยะทางที่ราคาขยับทันทีหลังจากเบรกเอาท์.
  3. ความหนาแน่นของฐาน: แท่งเทียนฐานน้อยหมายถึงการตอบสนองของสถาบันที่รวดเร็วและรุนแรงขึ้น (คะแนนสูงขึ้น).
    คะแนนนี้จะแสดงภายในขอบด้านขวาสุดของกล่องโซน.

4. วงจรชีวิตของโซน & กลไก "ความตาย"

เมื่อราคาจริงเคลื่อนไหว ตัวบ่งชี้จะอัปเดตสถานะของโซนแบบเรียลไทม์:

  • ใหม่ (ยังไม่ถูกแตะต้อง): โซนถูกสร้างขึ้นใหม่และมีความถูกต้องสูง กล่องจะยืดออกไปทางขวาโดยอัตโนมัติตามแท่งเทียนสดปัจจุบัน.
  • ถูกทดสอบ: ราคาสัมผัสโซนแต่ไม่ทะลุ สร้าง ลูกศรสัญญาณ (ซื้อ/ขาย) บนกราฟ.
  • ถูกลดทอน: ราคาทะลุเข้าไปลึกกว่า 50% ในโซน โซนกำลังอ่อนแอลง.
  • ถูกทำลาย (โซนความตาย): หากแท่งเทียน ปิด อย่างสมบูรณ์เลยขอบเขตตรงข้ามของโซน (เช่น ปิดต่ำกว่าโซนอุปสงค์) โซนนั้นจะถูกยกเลิกความถูกต้อง.
    • ปฏิกิริยาทางสายตา: โซนจะ หยุดยืดออก ไปทางขวาทันที (ยึดติดกับ DeathTime) และสีจะเปลี่ยนเป็นสีเทา Slate Gray จาง ๆ (สีความตาย) เพื่อแสดงว่าไม่ใช้งานแล้ว.

5. ตัวกรองการทับซ้อนหลายชั้น

เพื่อป้องกันไม่ให้กราฟรกเกินไป ตัวบ่งชี้จะตรวจสอบโซนที่ทับซ้อนกัน หากโซนที่ตรวจพบใหม่ทับซ้อนมากกว่า 70% กับโซนเก่าที่มีประเภทเดียวกัน โซนใหม่นั้นจะถูกละเว้น.

สรุป

AI summary
The Supply Demand Detector is a trading indicator designed to identify supply and demand zones by detecting institutional impulsive price moves. It operates by continuously calculating the average body size of recent candles and flags significantly larger candles as impulse candles, distinguishing between bullish impulses (demand zones) and bearish impulses (supply zones).

After detecting an impulse, the indicator identifies a cluster of smaller preceding candles called base candles, using their highest high and lowest low to define the zone boundaries. It assigns a strength score (0.00 to 1.00) to each zone based on impulse size, subsequent price movement, and base candle density, which is displayed on the chart.

The indicator tracks the lifecycle of zones in real-time, categorizing them as fresh, tested (with buy/sell signal arrows), mitigated, or broken (invalidated), with visual cues such as color changes and zone stretching adjustments. To reduce chart clutter, it filters out new zones that overlap more than 70% with existing zones of the same type.

This tool supports visualization of market structure through supply and demand zones, aiding traders in identifying potential reversal points based on institutional activity.
โปรไฟล์อินดิเคเตอร์
หมวดหมู่อินดิเคเตอร์
โครงสร้างตลาด (SMC)
ประเภทเอาต์พุต
การแสดงเป็นภาพ
ข้อกำหนดด้านข้อมูล
แท่งเท่านั้น
สัญญาณที่รองรับ
Reversal

รีวิวจากลูกค้า

0.0
รีวิว: 0
รีวิวจากลูกค้า
ยังไม่มีรีวิวสำหรับผลิตภัณฑ์นี้ หากเคยลองแล้ว ขอเชิญมาเป็นคนแรกที่บอกคนอื่น!

การสนทนา

คำถามที่พบบ่อย

Supply & Demand
ผลิตภัณฑ์ที่มีให้บริการผ่าน cTrader Store รวมถึงบอทการเทรด อินดิเคเตอร์ และปลั๊กอิน มีให้บริการโดยนักพัฒนาบุคคลที่สามและมีไว้เพื่อวัตถุประสงค์ในการเข้าถึงข้อมูลและทางเทคนิคเท่านั้น cTrader Store ไม่ใช่โบรกเกอร์และไม่ได้ให้คำแนะนำการลงทุน คำแนะนำส่วนบุคคล หรือการรับประกันผลการดำเนินงานในอนาคต

เพิ่มเติมจากผู้เขียนคนนี้

อินดิเคเตอร์
BOS
CHOCH
+3
Shows market structure (BoS/CHoCH) and key zones (OB/FVG) to help traders spot high-probability trade setups.
อินดิเคเตอร์
Risk Dashboard
AI-powered daily range forecasts help traders spot volatility opportunities and plan stops and targets.

นอกจากนี้คุณยังอาจชอบ

อินดิเคเตอร์
Fair Value Gap
Liquidity Sweep
Stop trading fake FVGs. Shows FVG ONLY after PDH/PDL Liquidity Sweep. SMC - No Repaint, Cloud Safe.
อินดิเคเตอร์
EMA
Supertrend
+4
Dynamic dual MA cloud indicator. Identifies trends, crossovers, and pullback entries in real time for any asset.
อินดิเคเตอร์
The long awaited new and improved Supply Demand Premium V2 indicator. Unlock greater trading opportunities now!
อินดิเคเตอร์
ATR
SMC
+19
Free Smart Money Concepts from TradingView for cTrader: BOS/CHoCH, OB, FVG, liquidity, MTF levels, discount zones.
อินดิเคเตอร์
Volume
Key Levels
+5
Volume Profile Pro - A Lightweight and Highly Customizable Side & Range Volume Profile
อินดิเคเตอร์
This indicator is an essential tool for traders seeking to visualize key trading sessions on their charts.
อินดิเคเตอร์
RSI
Breakout
+1
"Identify key market zones and visualize support/resistance from multiple timeframes on a single chart.
อินดิเคเตอร์
MSS
Volume
+3
Rejection-based volume profile with tiered heat zones, POC levels and a fully draggable anchor on cTrader.
อินดิเคเตอร์
Risk Dashboard
AI-powered daily range forecasts help traders spot volatility opportunities and plan stops and targets.
อินดิเคเตอร์
ATR
MSS
+3
Stop drawing levels manually. SmartLevels Pro detects, scores & predicts — H4/H1/M15 · cTrader
"RangeBoxLevel" โลโก้
ยอดนิยม
4.7
(4)
$29
อินดิเคเตอร์
Grid
Prop
+5
This technical analysis indicator provides information on market sentiment, trend and price levels....
อินดิเคเตอร์
Allow trader to draw multi trendlines in different timeframes on one chart,Give trader an overview of the current market
"PriceLevels" โลโก้
ยอดนิยม
4.7
(4)
$19
อินดิเคเตอร์
Displays the previous day's, last week's, and last month's highest and lowest price levels on your chart.
อินดิเคเตอร์
ATR
EMA
+3
EMA cross filtered by a trend average and its ATR channel, with long, short and close marks and colored candles.
"Market Structure Shift" โลโก้
เรตติ้งสูง
4.2
(4)
$19
/
$35
อินดิเคเตอร์
Prop
Forex
+11
Market Structure Shift – Professional Market Structure Oscillator
อินดิเคเตอร์
Forex
Crypto
+2
HTF Candle
"FX Market Sessions" โลโก้
เรตติ้งสูง
5.0
(6)
ฟรี
อินดิเคเตอร์
Forex
EURUSD
+3
Visualize trading sessions with high/low levels, customizable colors, and live open session display
อินดิเคเตอร์
Fisher Transform with smoothing. Spot reversals and cycles with precision. Great for any market, any timeframe.

ราคา

ตั้งแต่ 13/05/2026
1
ติดตั้งฟรี