คำอธิบาย
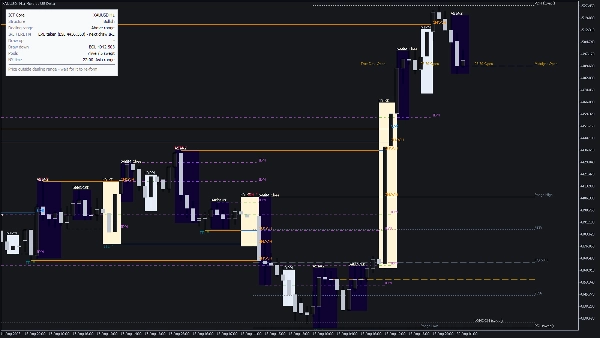
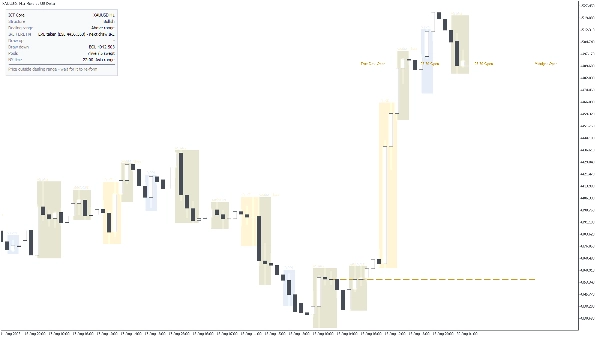
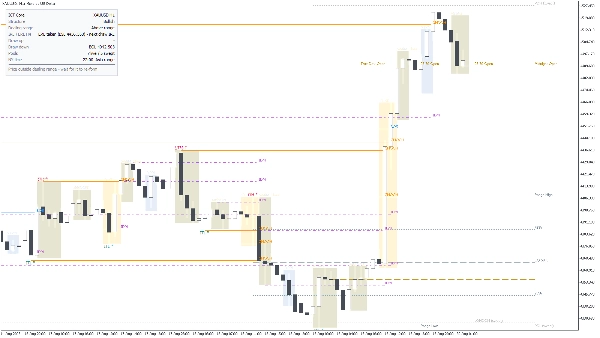
ICT Core เปลี่ยนแผนภูมิราคาดิบให้เป็นการอ่าน Smart Money Concepts (ICT) ที่มีโครงสร้าง: โครงสร้างตลาด, แหล่งสภาพคล่อง, ช่วงการซื้อขาย, สถานะ IRL / ERL, ช่วงเวลาการซื้อขายและ killzones ของนิวยอร์ก รวมถึงแผงที่แสดงความลำเอียงปัจจุบันและแผนเงื่อนไขเป็นภาษาอังกฤษง่ายๆ โดยดึงข้อมูลเฉพาะจากการเคลื่อนไหวราคาที่ปิดและยืนยันแล้ว — เมื่อระดับหรือป้ายถูกพิมพ์แล้วจะอยู่ที่นั่นเสมอ
สิ่งที่มันวิเคราะห์
ICT Core อ่านข้อมูลแท่งเทียน (เปิด / สูง / ต่ำ / ปิด) จากสัญลักษณ์แผนภูมิ พร้อมกับกรอบเวลาที่สูงกว่าหนึ่งช่วงที่คุณเลือก (ค่าเริ่มต้น H4) สำหรับการอ่าน IRL / ERL ใช้ ATR เพื่อปรับขนาดสวิง, ระยะห่างของป้าย และความทนทานของ equal-high / equal-low ดังนั้นการตั้งค่าเดียวกันจึงทำงานอย่างสม่ำเสมอบน XAUUSD, ดัชนี และ FX เวลาช่วงการซื้อขายและ killzone คำนวณตามเวลานิวยอร์กพร้อมการจัดการ DST อัตโนมัติ ไม่ใช่เวลาคงที่ของโบรกเกอร์
สิ่งที่มันวาดและวิธีอ่าน
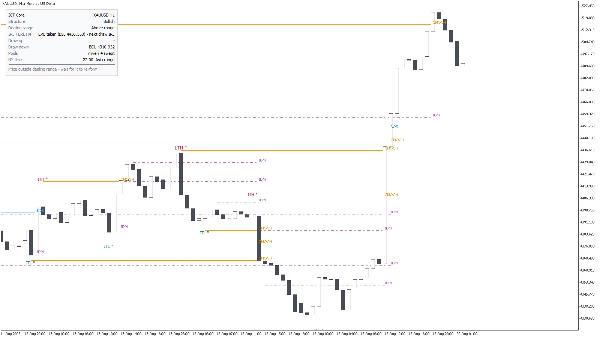
- โครงสร้างตลาด สวิงถูกจัดประเภทเป็นระยะสั้น, ระยะกลาง และระยะยาว การเบรกถูกติดป้ายว่า BOS (ต่อเนื่อง) หรือ CHOCH (เปลี่ยนลักษณะ); การเบรกที่เกิดจากไส้เทียนเท่านั้นจะถูกแท็กแยกเป็น sweep เพื่อให้คุณแยกความแตกต่างระหว่างการเคลื่อนที่จริงกับการบุก ราคาสูงและต่ำที่ถูกทำลายโดยขาแรงจะถูกแท็กว่าแข็งแกร่ง / อ่อนแอ
- Inducement (IDM) จุดสูงหรือต่ำเล็กน้อยที่ราคาน่าจะวิ่งก่อนการเคลื่อนไหวจริงถูกทำเครื่องหมาย เพื่อให้คุณเห็นกับดักก่อนที่จะถูกเปิดใช้งาน
- แหล่งสภาพคล่อง วันก่อนหน้า, สัปดาห์ก่อนหน้า, เดือนก่อนหน้า, ราคาสูงและต่ำของช่วงการซื้อขาย และ equal highs / equal lows ถูกวาดเป็นระดับฝั่งซื้อ (BSL) และฝั่งขาย (SSL) เมื่อแหล่งสภาพคล่องถูก sweep จะถูกทำให้จางลงแทนที่จะลบ เพื่อให้ประวัติของสิ่งที่ถูกใช้ไปแล้วยังอ่านได้
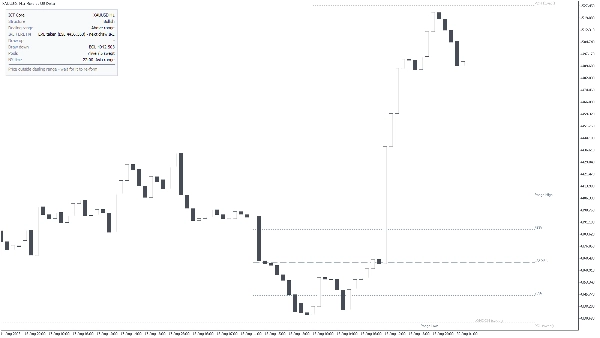
- ช่วงการซื้อขาย ช่วงที่ใช้งานระหว่างราคาสูงและต่ำที่ถูกต้องล่าสุด พร้อมด้วยสี่ส่วน 25% / 75% สำหรับการอ้างอิงพรีเมียม / ส่วนลด
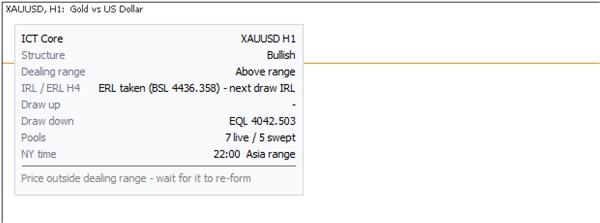
- IRL / ERL แผงแสดงว่ามีการใช้สภาพคล่องภายนอกแล้วและการวาดครั้งถัดไปเป็นภายใน หรือในทางกลับกัน โดยอ่านจากกรอบเวลาที่สูงกว่าที่คุณเลือก
- ช่วงเวลาและเวลา กล่องเอเชีย, ลอนดอน, NY AM และ NY PM; killzones ของลอนดอน, นิวยอร์ก และปิดลอนดอน; หน้าต่าง silver bullet; มาโคร 20 นาทีที่เลือกได้; และเส้นราคาเปิดช่วงการซื้อขาย
- แผงข้อมูล สัญลักษณ์และกรอบเวลา, ความลำเอียงโครงสร้าง, ตำแหน่งราคาภายในช่วงการซื้อขาย, สถานะ IRL / ERL, การวาดที่ใกล้ที่สุดด้านบนและด้านล่างพร้อมราคาของมัน, จำนวนแหล่งสภาพคล่องที่ยังใช้งานอยู่เทียบกับที่ถูก sweep, เวลานิวยอร์กและช่วงเวลาที่ใช้งาน — รวมถึงบรรทัดแผนเงื่อนไขเช่น "ราคานอกช่วงการซื้อขาย - รอให้มันก่อตัวใหม่"
- การแจ้งเตือน ป๊อปอัพ, เสียง หรืออีเมลเมื่อมีการ sweep แหล่งสภาพคล่อง, BOS / CHOCH, และเมื่อเปิด killzone
การตั้งค่าหลัก
- ทั่วไป: ธีมแผนภูมิ (อัตโนมัติ / สว่าง / มืด), จำนวนแท่งที่วิเคราะห์ (ค่าเริ่มต้น 1500), ขนาดฟอนต์ป้าย และระยะห่างระหว่างป้าย (ใน ATR)
- โครงสร้างตลาด: ความแข็งแรงของสวิงในแท่งแต่ละด้าน (ค่าเริ่มต้น 2), ระดับสวิงที่จะแสดง, เปิด/ปิด BOS / CHOCH, เปิด/ปิด การเบรกที่เกิดจากไส้เทียนเท่านั้น, เปิด/ปิด Inducement, และขนาดแรงกระตุ้นใน ATR ที่กำหนดว่าราคาสูงหรือต่ำเป็นแข็งแกร่ง (ค่าเริ่มต้น 1.0)
- แหล่งสภาพคล่อง: แหล่งที่จะแสดง, ความทนทานของ equal high / low ใน ATR (ค่าเริ่มต้น 0.15), จำนวนวันที่ก่อนแหล่งสภาพคล่องหมดอายุ (ค่าเริ่มต้น 20), และว่าแหล่งที่ถูก sweep จะยังคงมองเห็นได้หรือไม่
- ช่วงการซื้อขาย: เปิด/ปิดช่วง, เปิด/ปิดสี่ส่วน 25% / 75%
- IRL / ERL: กรอบเวลาต้นทาง (ค่าเริ่มต้น H4) และจำนวนแท่งที่จะสแกน (ค่าเริ่มต้น 300)
- ช่วงเวลา: กล่องช่วงเวลา, killzones, silver bullet, มาโคร, ราคาการเปิด, จำนวนวันที่ย้อนหลังที่จะแสดง (ค่าเริ่มต้น 5), และความทึบของกล่อง
- แผง: มุม, การเลื่อน X / Y, ขนาดฟอนต์, ว่าจะแสดงแถวแผนหรือไม่, จำนวนแท่งที่ sweep ยังนับว่าใหม่ (ค่าเริ่มต้น 12), และว่าแผนต้องการ killzone ที่ใช้งานอยู่หรือไม่
- การแจ้งเตือนและชุดสีเต็มสำหรับทุกองค์ประกอบบนแผนภูมิ
การใช้งานทั่วไป
1. เพิ่ม ICT Core ลงในแผนภูมิ M5 - H1 ของ XAUUSD, ดัชนี หรือคู่ FX หลัก
2. อ่านแผงจากบนลงล่าง: ความลำเอียง, ตำแหน่งในช่วงการซื้อขาย, IRL / ERL, และการวาดที่ใกล้ที่สุดด้านบนและด้านล่าง
3. รอให้แหล่งสภาพคล่องถูก sweep ภายใน killzone จากนั้นมองหา CHOCH ตรงข้ามกับการ sweep ในกรอบเวลาที่คุณจะเข้า
4. ใช้การวาดตรงข้ามที่แสดงในแผงเป็นเป้าหมาย และจุดสุดขั้วที่ถูก sweep เป็นการยกเลิก
5. เปิดการแจ้งเตือน sweep และ BOS / CHOCH หากคุณไม่ต้องการดูแผนภูมิทั้งช่วงเวลา
เหมาะสำหรับใคร
เทรดเดอร์ที่ทำงานกับ ICT / Smart Money Concepts อยู่แล้วและต้องการชั้นโครงสร้าง, สภาพคล่อง และเวลาบนแผนภูมิเดียวแทนการวาดด้วยมือทุกวัน เหมาะสำหรับเทรดเดอร์แบบ discretionary ระยะสั้นและ intraday ไม่ใช่เครื่องมือลูกศรซื้อ/ขายสำหรับผู้เริ่มต้น — คุณต้องรู้ความหมายของ BOS, CHOCH, IDM, IRL และ ERL เพื่อใช้งาน
ข้อจำกัดและข้อควรทราบที่สำคัญ
- ICT Core เป็นเครื่องมือวิเคราะห์และแสดงผล ไม่ได้ส่งคำสั่งซื้อขาย, ไม่ได้ให้สัญญาณซื้อ/ขาย และแถวแผนเป็นเพียงการเตือนเงื่อนไข ไม่ใช่คำแนะนำ
- ทุกอย่างมาจากสวิงที่ยืนยันแล้ว ดังนั้นจุดโครงสร้างจะปรากฏหลังจากแท่งที่ต้องการปิดครบทั้งสองด้าน (ค่าเริ่มต้น 2) ไม่มีการวาดใหม่หลังจากนั้น
- เวลาช่วงและ killzone ตามเวลานิวยอร์กรวม DST แผนภูมิของคุณแสดงตามเวลาของเซิร์ฟเวอร์โบรกเกอร์ ดังนั้นกล่องจะไม่ตรงกับการเลื่อน UTC คงที่ — นี่คือสิ่งที่ตั้งใจไว้
- การอ่าน IRL / ERL ในกรอบเวลาที่สูงกว่าต้องมีประวัติข้อมูลเพียงพอ; สำหรับสัญลักษณ์ที่มีประวัติสั้นจะแสดงว่าไม่พร้อมใช้งาน
- การวิเคราะห์จำกัดอยู่ในหน้าต่างแท่งที่วิเคราะห์ (ค่าเริ่มต้น 1500) เพิ่มจำนวนเพื่อประวัติที่มากขึ้น แต่แลกกับการวาดครั้งแรกที่หนักขึ้น
- ทำงานบน cTrader Desktop สำหรับ Windows และ Mac ตัวชี้วัดที่กำหนดเองไม่สามารถใช้ได้บนมือถือหรือเว็บ
- การเทรดมีความเสี่ยง พฤติกรรมในอดีตของรูปแบบใดๆ ไม่รับประกันผลลัพธ์ในอนาคต ใช้การจัดการความเสี่ยงของคุณเองเสมอ
สรุป
ICT Core highlights liquidity pools from previous days, weeks, months, and sessions, showing buy-side and sell-side levels, and dims swept pools to maintain historical context. It also delineates session times and killzones based on New York time with automatic daylight saving adjustments. An info panel provides a summary of current bias, price position within the dealing range, IRL/ERL status, nearest levels, live versus swept pools, and a conditional trading plan in plain English.
Users can customize settings including chart theme, swing parameters, liquidity pool visibility, session displays, and alert notifications for pool sweeps, BOS/CHOCH events, and killzone openings. ICT Core is intended for traders familiar with ICT/SMC concepts seeking an integrated, structured view of market dynamics for intraday and short-swing discretionary trading.


!["Gaussian Channel [Iridio Capital]" โลโก้](https://cdn.ctrader.com/image/webp/2c4f9ca9-4e9b-476d-b5a6-787c8095032b_61546)