Penerangan
Penunjuk VPD
VPD adalah penunjuk yang disyorkan untuk mereka yang melakukan operasi intrahari, dalam mana-mana simbol Forex.
Ia terdiri daripada gabungan beberapa parameter, iaitu:
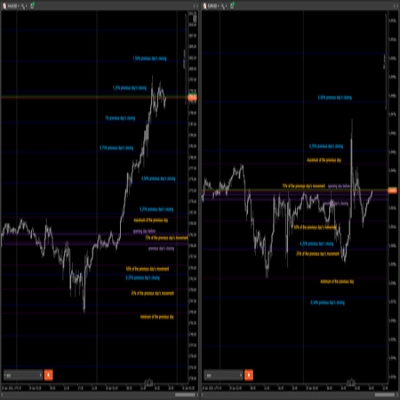
• Pembukaan dan penutupan hari sebelumnya;
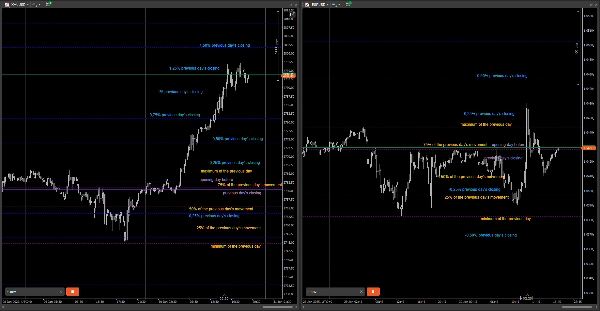
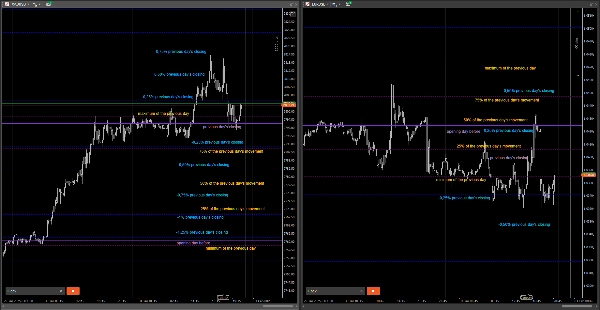
• Maksimum dan minimum hari sebelumnya dengan variasi peratusan pertengahan 25%, 50% dan 75% (ia boleh dikonfigurasikan) bagi keseluruhan pergerakan hari sebelumnya;
• Variasi harga dalam peratusan penutupan hari sebelumnya sebanyak -2%, -1.75%, -1.50% ... +1.50%, +1.75%, +2% (ia boleh dikonfigurasikan).
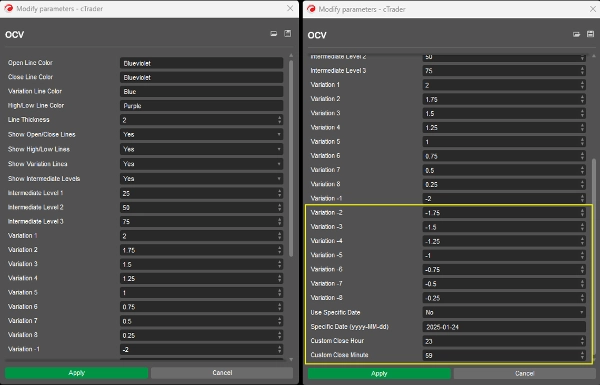
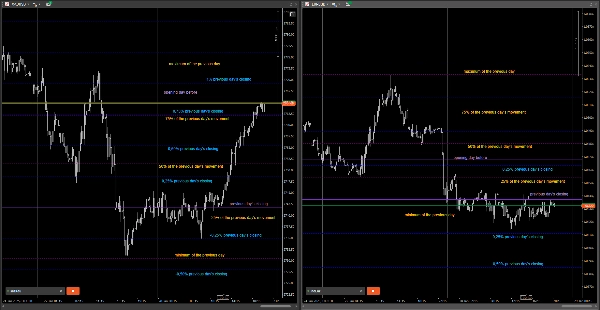
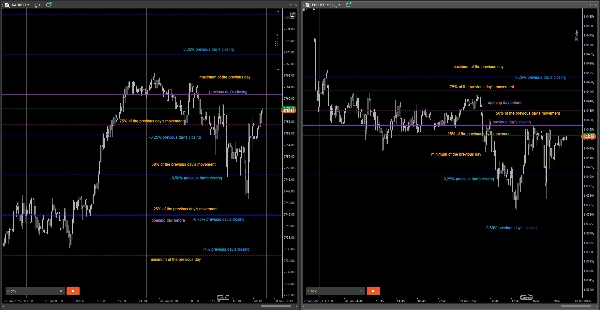
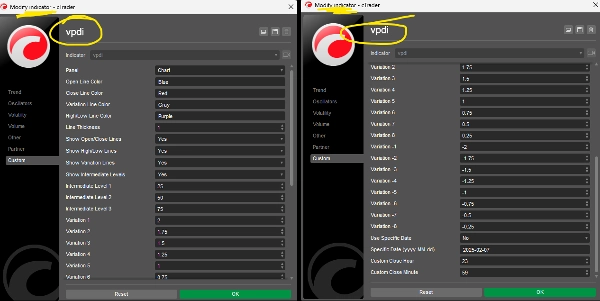
Anda boleh memilih untuk menukar warna, ketebalan garis dan peratusan, serta memutuskan yang mana anda mahu tunjukkan pada graf, seperti contoh di bawah.
Jika anda mahu ia dipaparkan dalam tempoh masa tertentu, anda boleh memberitahu tarikh dan masa.
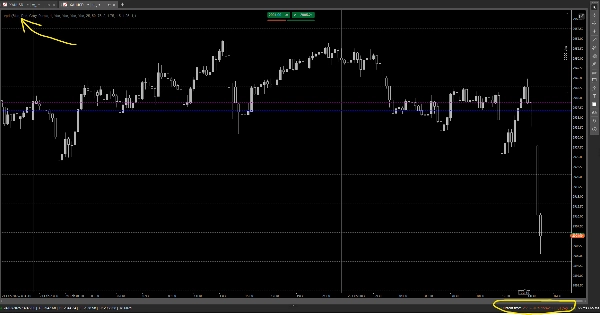
(Dalam cetakan ia adalah sebagai cbot, tetapi kemudian saya menukarnya kepada penunjuk.)
Saya telah mengemas kini dengan tangkapan skrin (menunjukkan penunjuk pada carta) dengan tarikh hari ini (25/02/2025).
E-mel hubungan: ortsac.nanido@gmail.com


![Logo "[Stellar Strategies] MARSI Signal Plotter"](https://cdn.ctrader.com/image/webp/7b2b8da6-8f8e-4646-8d4a-4710c516c01e_25567)


